On most policy questions, public opinion changes slowly, if at all.
But when new issues arise, important shifts can occur before opinion sorts itself into settled patterns. And, on occasion, critical events can jar opinion from settled patterns into a new equilibrium.
These generalizations apply as much to education policy as to opinion in other areas of public life. During the eight years (2007 to 2014) that the Education Next (EdNext) poll has been administered to a representative sample of American adults (and, in most of these years, to a representative sample of public school teachers), we have seen only minimal changes from one year to the next on such important issues as charter schools, merit pay, teacher tenure, teachers unions, and tax credits that fund private-school scholarships. That pattern persists into 2014, despite heated public disputes concerning many of these topics.
Sometimes sharp changes in opinion do occur. For example, the share of the public that say it favors the Common Core State Standards slipped noticeably between 2013 and 2014. Establishing a common set of standards across states is a new policy proposal that emerged as a public issue only in 2011, and it appears as if many citizens have yet to decide where they stand on the matter. Also, in 2009 we observed a steep drop in public support for higher school expenditures and higher teacher salaries in the wake of the financial crisis and the economic recession. We now find that even by 2014 support for expenditures and salary increases has not returned to 2008 levels, at least among respondents told current per-pupil expenditures and teacher salary levels. A new, lower equilibrium has been established, perhaps because of the wallet tightening required by the slow, uneven economic recovery.
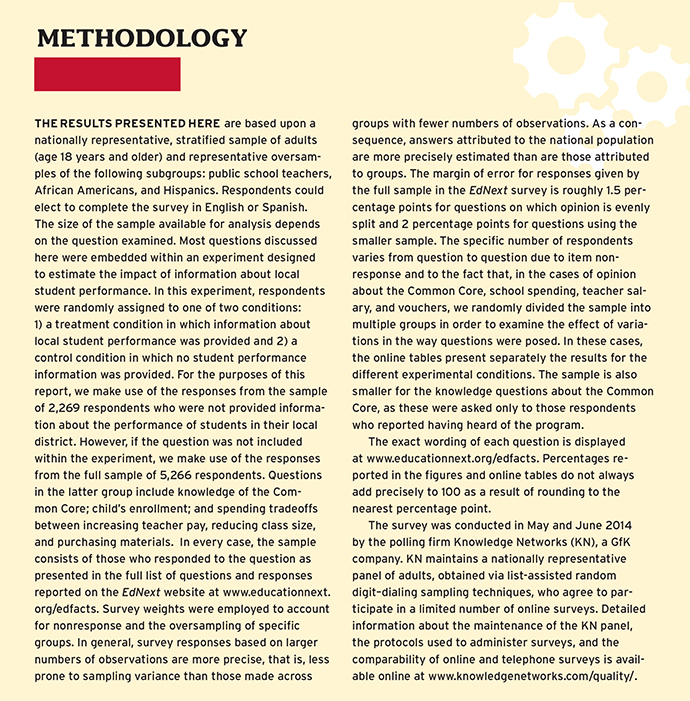
These are among the many findings to emerge from this installment of the EdNext Survey, administered to some 5,000 respondents in May and June of 2014 (see methodology sidebar below). Among other key findings are the following:
1) While Americans asked to evaluate the quality of teachers’ work think, on average, that about half of the teachers in their local schools deserve a grade of A or B, they think that more than one-fifth deserve a D or F; even teachers give these low marks to more than 1 in 10 of their peers, on average.
2) More than one-fourth of all families with school-age children have educated a child in a setting other than a traditional public school.
3) The public thinks less money should be spent on class-size reduction relative to the amount spent on teacher salaries or new books and technologies, if they are told the relative price of each intervention.
We discuss these and other topics in this review of the 2014 EdNext poll, the complete results of which are available here.
Common Core State Standards
Public debate over a nationwide effort to set common education standards has been raging in many states over the past year. Encouraged by the federal Race to the Top initiative, 45 states had by 2011 quietly adopted benchmarks that detail what students should learn at each grade level, set by the Common Core State Standards Initiative (CCSSI), an entity formed by the National Governors Association and the Council of Chief State School Officers. Yet the undertaking has become increasingly controversial as the standards have been implemented and appropriate tests devised. While most states remain committed to the standards, opposition has been voiced both by conservative groups who fear expanded federal control and by teachers unions worried about the consequences for teacher evaluation. Five states under the leadership of conservative governors—Indiana, Missouri, North Carolina, Oklahoma, and South Carolina—have either repealed the standards or initiated a process to review them. From a quite different place on the political spectrum, the New York affiliate of the National Education Association has withdrawn its support for the Common Core as implemented in that state, and the American Federation of Teachers is calling for a moratorium on all consequences attached to student test results while the standards are being implemented, a policy that has been affirmed in California.
 Declining, polarizing public support. The controversy has had a striking impact on public opinion. Although a majority of the public continues to support the standards set by CCSSI, and supporters outnumber opponents by a two-to-one margin, trend lines show serious erosion in support. In 2013, no less than 65% of the general public favored the standards, but that portion is now just 53% (see Figure 1). Meanwhile, the opposition has doubled from 13% to 26%. (The share taking no position on the issue has remained essentially unchanged, at 21% in 2014.)
The debate has had a polarizing effect as well. In 2013, CCSSI gathered backers from across the political spectrum. Since then, support among Republicans has fallen from 57% to 43%, while support among Democrats has remained nearly unchanged (64% in 2013 and 63% in 2014). Opposition among Republicans jumped from 16% in 2013 to 37% in 2014. Opposition grew among Democrats as well, but to a much smaller degree; only 17% of Democrats express opposition now, up from 10% in 2013.
The staunchest opposition comes from the conservative wing of the Republican Party. The Common Core has the support of a majority of self-described “moderate” Republicans (57%) and a plurality of “slightly conservative” Republicans (45%). It drops off considerably among Republicans who describe themselves as “conservative” (38%) or “extremely conservative” (23%).
Declining teacher support. Teachers, too, have soured on the Common Core (see Figure 1). Just a year ago, 76% of teachers backed the Common Core, but the portion in favor has now plummeted to 46%. Meanwhile, teacher opposition has more than tripled, from 12% to 40%. (The percentage without a position on the issue remains essentially unchanged.) Once again, signs of polarization are evident, with positive views expressed by Republican teachers falling by 34 points, from 69% in 2013 to 35% in 2014, while among Democratic teachers the percentage has slipped only 15 points, from 69% to 54%.
Especially intriguing is the flip in the opinion gap between teachers and the public as a whole. In 2013, teachers were more positive in their views of the Common Core than the public (76% compared to 65%), but today teachers are less positive (46% compared to 53%). A year ago, only 12% of the teaching force expressed opposition—virtually the same as the public. Today, teacher opposition is nearly twice as high as opposition among the public (40% compared to just 26%).
A Tainted Brand? The words “Common Core” elicit greater antagonism than does the concept of common standards itself. We discovered this by asking one randomly chosen half of our respondents the same question as was posed to the other half, except that we dropped any specific mention of the Common Core. The difference in the questions posed to the two groups is in brackets below:
As you may know, in the last few years states have been deciding whether or not to use [the Common Core, which are] standards for reading and math that are the same across the states. In the states that have these standards, they will be used to hold public schools accountable for their performance. Do you support or oppose the use of these [the Common Core] standards in your state?
When the Common Core label is dropped from the question, support for the concept among the general public leaps from 53% to 68%. Significantly, the pronounced partisan polarization evoked by the phrase Common Core disappears when the question does not include those seemingly toxic words. The level of support among Republicans is 68%, virtually identical to the Democratic level of support. In other words, a broad consensus remains with respect to national standards, despite the fact that public debate over the Common Core has begun to polarize the public along partisan lines.
Perceptions versus CCSSI Stated Principles. When people oppose a label but not the basic concept to which it is attached, it may mean they have heard the label but understand it to refer to something else, possibly something more far-reaching. CCSSI emphasizes that state participation remains voluntary, that local educators will retain control over instructional materials, and that the federal government will not gain access to information on individual students. As of now, each of these claims is factually correct.
Critics note, however, that the federal government has encouraged states to adopt the Common Core through the Race to the Top competitive grant program and a streamlined path to waivers from the provisions of No Child Left Behind. They warn that adoption of the Common Core will inevitably lead to greater federal control over instructional materials and monitoring of individual students’ performance.
Who is winning the battle of public perception of Common Core design? To find out, we first asked individuals whether or not they had heard of the standards (we asked this question before gauging support). Only 43% of the public—but 89% of teachers—says it had heard of the Common Core before the survey, indicating that the debate over the Common Core has yet to register in the minds of many Americans.
We then asked those respondents who said they had heard the phrase to identify three statements as true or false or to say they do not know. In no case did a majority of the respondents give an answer that corresponded with CCSSI’s stated principles. In two instances only a small minority understood the principles in the same way as CCSSI itself (see Figure 2).

Teacher perceptions were much more consistent with CCSSI’s stated view, however. Although a majority of teachers perceived two of the three statements in Figure 2 in a way that is consistent with CCSSI’s position, only a minority of the public perceived any of these statements in the same way that CCSSI does. This may indicate that opposition to the Common Core is driven, in part, by misconceptions.
Yet among the public, supporters and opponents of the Common Core differ significantly in their assessment of only the last of these statements. Supporters are more likely than opponents to say that the Common Core allows local school districts to decide which textbooks and materials to use in their schools (64% compared to 30%). Apparently, CCSSI needs to reassure the public that the new standards allow local districts to make key curricular decisions.
Evaluating Teachers
 Teacher-tenure laws leaped on to the front page of the national media in 2014 when a California judge responded favorably to a plaintiff’s argument that the state’s teacher-tenure laws violate its state constitution. While defenders of tenure claim that it merely protects teachers from arbitrary dismissal, critics contend that tenure now makes it extremely difficult to remove poorly performing teachers from the classroom. Where do Americans come down on the issue of teacher tenure? Just how many of America’s teachers do they think are ineffective?
We explored these issues by asking respondents to grade teachers on the same A-to-F scale traditionally used to evaluate student performance. Specifically, we asked them what percentage of teachers in the local schools deserved each letter grade. The average member of the public says that 50% of teachers at the local schools deserve an A or a B. If we use the traditional definition of a C grade as “satisfactory,” then the public, on average, thinks about one-fifth of teachers in the local schools are unsatisfactory (13% D and 9% F) (see Figure 3).
Teachers, though more positive toward their peers, do not entirely disagree with the public’s judgment. The average teacher thinks 69% of his or her colleagues in local schools deserve an A or a B. Even teachers say 5% of their colleagues in local schools are failures deserving an F, with another 8% performing at no better than the D level.
Perhaps because the public is concerned about the performance of some teachers, 50% of those interviewed oppose “giving tenure to teachers” altogether. Only 32% favor the idea (and another 18% take no position). We followed this question with another asking whether teachers should demonstrate that their students are making adequate progress on state tests in order to receive tenure. Overall, 60% of the public liked the idea. Even 65% of respondents who favor tenure say it should be based on student performance. Only 9% of Americans favor “giving teachers tenure” and oppose using student performance on state tests to determine tenure.
Teachers unions, of course, remain s teadfast in their defense of teacher tenure. Dennis Van Roekel, the outgoing president of the National Education Association, described the California lawsuit as “yet another attempt by millionaires and corporate special interests to undermine the teaching profession and push their own ideological agenda on public schools.” American Federation of Teachers president Randi Weingarten assured her members that “this [decision] will not be the last word.”
But, surprisingly, a majority of teachers do not favor the status quo of most states, under which most teachers receive tenure as a matter of course without explicit consideration of student-achievement data. It is true that teachers endorse tenure by a two-to-one margin: 60% in favor, with 32% opposed. Furthermore, only 31% of teachers like the idea of basing tenure on student test performance. But when responses to the two questions are combined, just 41% of teachers both favor tenure and oppose using information from state tests when awarding it. In short, when it comes to the teacher-tenure laws in most states, less than half of teachers and fewer than 1 in 10 Americans prefer the status quo.
It is no surprise then, that a plurality of the public (41%) says that teachers unions have a “negative effect” on the local schools and just 34% says they have a “positive effect.” Both numbers remain essentially unchanged since last year.
Teachers, meanwhile, are far more generous in their assessment of their unions’ influence and appear to have become less critical of the unions over the past year. Fifty-nine percent of teachers now report that teachers unions have a positive effect on schools. The share of teachers saying that teachers unions have a negative effect fell from 31% to 23% between 2013 and 2014, widening the gap between the public as a whole and teachers over the role of unions in American public education.
Teachers and the public also remain sharply divided on the issue of merit pay. Fifty-seven percent of the public supports “basing part of the salaries of teachers on how much their students learn,” while 31% opposes this idea. Among teachers, however, just 21% support merit pay and fully 73% are opposed. This 36-point gap in support between teachers and the public is the largest observed for any item on our survey.
Beyond Traditional Public Schools
The practice of school choice has now spread to such an extent that more than one-fourth of all American families have a school-age child who has been educated elsewhere than in a traditional public school. Many American families are ignoring the bright lines routinely drawn between traditional public schools on the one hand and charter schools, private schools, and home schooling on the other. We asked respondents who live with children aged 6 to 17 to report whether those children have ever attended a traditional public school, a charter school, or a private school, as well as whether they have been home schooled. No fewer than 26% percent of respondents living with school-age children have used an alternative to traditional public schools at some point in those children’s education. About 16% of them have combined multiple types of schooling.
The vast majority of respondents with school-age children in the home (87%) have experience with traditional public schools, and most rely on them exclusively (see Figure 4). Still, 14% have used private schools, and 9% have enrolled children in charter schools. Charters attract a larger share of African Americans living with school-age children (15%). Even home schooling has a broad constituency. Eight percent of respondents living with school-age children said that at least one of the children has been home schooled.

Teachers make just as much use of these alternatives as the public at large. About 28% of teachers living with school-age children have used or currently use private schools, charter schools, or home schooling alongside or in lieu of traditional public schools. The most heavily used alternative for teachers is private school (19%), but 8% and 7% use charter schools and home schooling, respectively. School choice is no longer an abstract concept. It is part and parcel of the American educational fabric, directly affecting 26% of all Americans living with school-age children.
School Choice
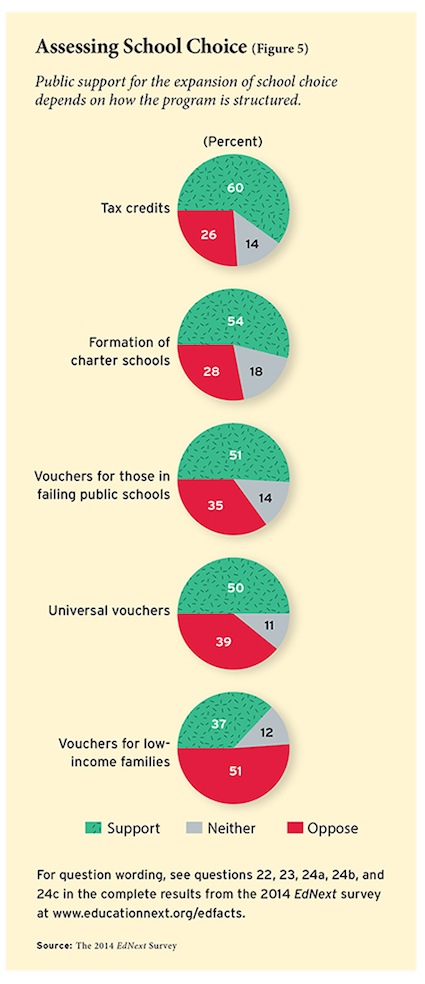
Given that Americans use the school-choice options available to them, it is worth asking, Do Americans support the expansion of choice, especially when it is targeted to disadvantaged students? The answer, it seems, depends on how the program is structured.
 Charter schools. Public discussion of charter schools recently escalated with the election of Mayor Bill de Blasio, who promised to limit charter school access to school-district facilities in New York City. When charter school supporters marched in the city’s streets and rallied at the state capitol in Albany, they won enthusiastic support from Governor Andrew Cuomo and favorable action in the state legislature. Similar battles between charter detractors and supporters have taken place in Chicago, Los Angeles, and many other parts of the country.
Despite all the public disputation, public opinion on charters remains essentially unchanged. It is true that a higher percentage of the public is now willing to take a position on the issue, one way or another. The percentage of those surveyed who say they “neither support nor oppose” charters declined 5 percentage points (from 23% to 18%) over the past year. But charter proponents continue to hold a near two-to-one advantage over opponents. Support increased slightly from 51% to 54%, while opposition ticked up from 26% to 28%. It appears as though the controversies have only convinced citizens that their original opinions were correct all along (see Figure 5).
School vouchers and tax credits. School-voucher and tax-credit programs that enable more families to choose a private school are also becoming a more familiar part of the U.S. education system. Half of the states now have a school-voucher or tax-credit program of some kind, according to the Friedman Foundation, a leading organization promoting private school choice. Most common is a tax-credit program that allows businesses or individuals to contribute to organizations that distribute private-school scholarships to low-income families. The public remains favorably disposed toward this policy. Sixty percent favors the idea, with just 26% opposed, a margin of support that exceeds that observed not only for charter schools, but also for school voucher programs benefiting the same population of students.
When it comes to school vouchers, modest shifts appear to be occurring in opposite directions (see Figure 5). The public is somewhat less inclined to favor vouchers for low-income families in 2014 than it was a year ago, but it is a bit more willing to lend support to universal vouchers for all families. (In both cases, the changes over the past year fall just shy of statistical significance.)
To gauge support for vouchers directed toward poor families, we asked respondents whether they favored “a proposal…that would use government funds to pay the tuition of low-income students who choose to attend private schools.” Opposition to the idea shifted upward from 45% in 2013 to 51% this year, while support slipped from 41% to 37%. On the other hand, support for universal vouchers went up a bit. Respondents were asked whether they favored “a proposal…that would give families with children in public schools a wider choice, by allowing them to enroll their children in private schools instead, with government helping to pay the tuition.” To that question, 50% of those surveyed responded positively, an uptick of 5 percentage points since 2013.
If the public resists vouchers made available only to low-income families, that hardly means it is opposed to helping the disadvantaged. If a voucher proposal is directed toward families with students attending failing schools, 51% of the public favors the idea; just 35% is opposed.
Blended learning. The public has yet to be sold on the idea of blended learning, a recent innovation that gives students opportunities to learn online within the traditional school day. When respondents were asked whether they favored “students spending more of their time at school receiving instruction independently through or on a computer,” opinion was evenly divided. While 42% responded positively, 41% gave a negative response.
How Much to Spend and How to Spend It
The public underestimates public school expenditure levels by a wide margin. When we asked respondents to estimate how much was spent per pupil in their local school district, the average response was short of $6,490, just over half the actual per-pupil expenditure levels of $12,400 in the districts reported for the school year ending in 2011 by the U.S. Department of Education. Similarly, the public grossly underestimates levels of teacher compensation. Members of the public estimate teacher salaries in their own state, on average, to be less than $38,900, barely two-thirds of the $57,000 average reported for 2012 by the U.S. Department of Education for the states in which respondents lived.
Given this misperception of expenditure and salary levels, receiving additional information on these subjects has a major impact on the public’s assessment of the need for an increase. When the public is provided with specific information on the current level of expenditure in the local school district, it is less willing to spend more money on schools than when this information is not given. We have noted this difference each year since we began asking one-half (randomly chosen) of our sample for an opinion only after supplying this information while leaving the other half uninformed.
Among informed respondents, public support for greater spending on local schools remains well below levels reached in the spring of 2008 (see Figure 6). At that time, the country did not realize it was about to enter a deep recession followed by a prolonged, uneven recovery, and 50% of the public was ready to spend more on schools even after being told current levels of per-pupil expenditure in the local school district. By the same time the following year, the country was in the midst of a severe financial crisis, and public support for more spending, when given information on current levels of expenditure, plummeted to 38%. Support for more spending has hovered in the low 40s since, with just 43% endorsing higher expenditure in 2014.

But among those not told current levels of expenditure, support for more spending remains nearly as high as it was in 2008. In that year, 61% of the “uninformed” public (those not told current expenditure levels in their local district) endorsed more spending. In 2014 that percentage is still 60%, fully recovered from the drop to 46% registered in 2009 when the financial crisis was on the country’s mind. Only if the public is aware of current expenditure levels is it more cautious than previously about committing additional funds to the schools.
A similar pattern is ob-served for increments in teacher salaries. In 2008, the portion favoring higher salaries among those told average salary levels in their state was no less than 54%. But in 2009 that percentage fell to 40%, and it has remained at that low level ever since. In 2014, only 38% of those informed of current teacher salaries were prepared to support a salary boost.
Among those not given information about current salaries, 69% thought teacher pay should be boosted back in 2008. That percentage skidded to 56% in 2009 and dropped to a low of 52% in 2011. But it has since crept higher, reaching 62% in 2014.
Deciding how much to spend on public schools is only the first step; school districts must also determine how to use whatever resources are made available. Reducing class size is a generally popular idea, but a number of researchers have concluded that increasing teacher salaries may be a better long-term strategy for school improvement. Does the public share this view? Would it prefer to devote any new spending on public schools to higher teacher salaries or smaller classes? Or would it instead prefer to see the money spent on new books and technologies?
When asked about these issues in the abstract, the public is most enthusiastic about reducing class size. Forty-six percent of the public selects that option, compared with 30% who would purchase new books and technology, and 24% who would increase teacher salaries (see Figure 7).

Enthusiasm for class-size reduction drops sharply, however, when information is provided that makes clear the tradeoff between spending to produce smaller classes and other options facing a typical American school district. One group of survey respondents, randomly chosen, was told, “Reducing average class sizes by three students would cost roughly the same amount as increasing teacher salaries by 13% or buying $10,000 in new books and technologies for each class every year.” Among this group, just 35% of the public favored reducing class size, while 33% preferred increasing teacher salaries and 32% would purchase new books and technology.
When uninformed of costs, teachers were even more committed than the public to smaller classes, with 54% selecting that option and only 37% preferring a salary increase. Just 9% of teachers would prefer to see the money spent on new books and technology. When relative costs were explained, the change in teacher opinion was even more pronounced than among the public, with support for class-size reduction dropping from 54% to 38%, and support for a salary increase jumping from 37% to 48%.
In short, accurate information also influences the public’s view on how best to allocate education dollars. Helping citizens understand the tradeoffs involved in efforts to reduce class size may lead to better decisions about how to use the funds we invest in public education.
Conclusions
Readers will decide for themselves which of the many findings reported in the 2014 poll are of greatest interest. In our view, the poll yields four especially important new findings:
1) Opinion with respect to the Common Core has yet to coalesce. The idea of a common set of standards across the country has wide appeal, and the Common Core itself still commands the support of a majority of the public. But proponents probably need to clarify their intentions to the public if they are to keep support from slipping within both the nation’s teaching force and the public at large.
2) Americans give good grades to about half the teaching force in their local district, but they hand out an unsatisfactory grade (D or F) to nearly one-fifth of the teachers. This may help explain why a majority of the public opposes teacher tenure. However, a majority of teachers favor tenure and, in general, teachers give their colleagues a higher grade than the public does. Yet they still give about one-tenth of teachers one of the two low grades.
3) In a quarter of households with school-age children, a child is attending or has attended a school other than the traditional public school.
4) Members of the public are less inclined to favor using additional funds for class-size reduction if they know its cost relative to the cost of teacher pay and the purchase of new books and technologies.
Michael B. Henderson is research director for the Public Policy Research Lab at Louisiana State University. Paul E. Peterson, editor-in chief of Education Next, is professor and director of the Program on Education Policy and Governance at the Harvard Kennedy School. Martin R. West is associate professor at the Harvard Graduate School of Education and deputy director of the Program on Education Policy and Governance at the Harvard Kennedy School.
Find complete results of the 2014 Education Next poll here.
This article appeared in the Winter 2015 issue of Education Next. Suggested citation format:
Henderson, M.B., Peterson, P.E., and West, M.R. (2015). No Common Opinion on the Common Core. Education Next, 15(1), 8-19.