
Executive summary
In a previous Evidence Speaks report, I described the high rates at which student loan borrowers default on their repayment within 12 years of initial college entry, often on relatively modest amounts of debt. One of the most striking patterns emerging from that report and other prior work is how dramatically default rates vary by institution sector and by race/ethnicity: black, non-Hispanic entrants and for-profit entrants experience default at much higher rates than other students. In this report, I use the same source of data to examine whether these disparities in default rates can be explained by other factors. I also examine what happens after a default, and whether this also varies by race or institution sector.
I find differences in student and family background characteristics, including measures of family income and wealth, can account for about half of the black-white gap in default (reducing it from 28 to 14 percentage points). But even accounting for differences in degree attainment, college GPA, and post-college income and employment cannot fully explain the black-white difference in default rates, which remains large and statistically significant at 11 percentage points in the most complete model.
Similarly, differences in student and family background characteristics can account for slightly less than half of the gap in default rates between for-profit borrowers and public two-year college borrowers (reducing it from 25 to 14 percentage points). Somewhat surprisingly, the gap across sectors is not fully explained by differences in attainment, or by measures of employment and earnings. Entering a for-profit is associated with a 10-point higher rate of default even after accounting for everything else in the model.
Adjusted and unadjusted gaps both provide important information; one is not more “correct” than the other. The adjustments are only as good as the measures included, and better data on earnings, employment, and other post-college circumstances might explain more of the gap. Differences in loan counseling or loan servicing might also play a role. The better we can understand what drives these stark gaps, the better policymakers can target their efforts to reduce defaults.
An additional analysis of what happens post-default shows that more than half of all defaulters (54 percent) were able to successfully resolve at least one of their defaulted loans via rehabilitation, consolidation, paying in full, or having a loan discharged. At least 14 percent of defaulted borrowers managed to emerge from default and re-enroll in school. While there is no black-white difference in resolution rates conditional on default, white defaulters are more likely to rehabilitate defaulted loans while black defaulters are more likely to consolidate. Similarly, defaulters from for-profit institutions were more likely to consolidate and less likely to rehabilitate a defaulted loan than defaulters from public two-year institutions.
Background and data
This report utilizes data released by the U.S. Department of Education in October 2017, linking survey and administrative data from the Beginning Postsecondary Student (BPS) surveys to administrative data on debt and defaults from the National Student Loan Data System (NSLDS). I focus on the BPS 2003-04 survey sample, which is nationally representative of college entrants who enrolled for the first time in 2003-04. [1] Respondents were re-surveyed in 2006 and 2009, and the NSLDS data are available through 2015, enabling certain outcomes to be measured up to 12 years after initial college entry. While some of the statistics reported below are publicly accessible from the National Center for Education Statistics (NCES) using the online Power Stats tool, I have computed others using the individual-level data which can only be obtained via a restricted-use data license. Where possible, I have validated my calculations using the restricted data against publicly available measures.
Figure 1 below summarizes previously reported rates at which student experience a default within 12 years of entry, by sector and by race for the BPS-2004 cohort. Figure 2 provides the same information, but limited to undergraduate borrowers only. [2] The figures show that 17 percent of all entrants (28 percent of undergraduate borrowers) experienced a default within 12 years of entry. The figures also highlight the stark disparities in default by sector and race/ethnicity. For-profit entrants are nearly four times as likely to experience a default compared to public two-year entrants (47 percent versus 13 percent), while black non-Hispanic entrants are more than three times as likely as white non-Hispanic entrants to experience a default (38 percent versus 12 percent).
Figure 1. Ever defaulted, by sector and race (All entrants)
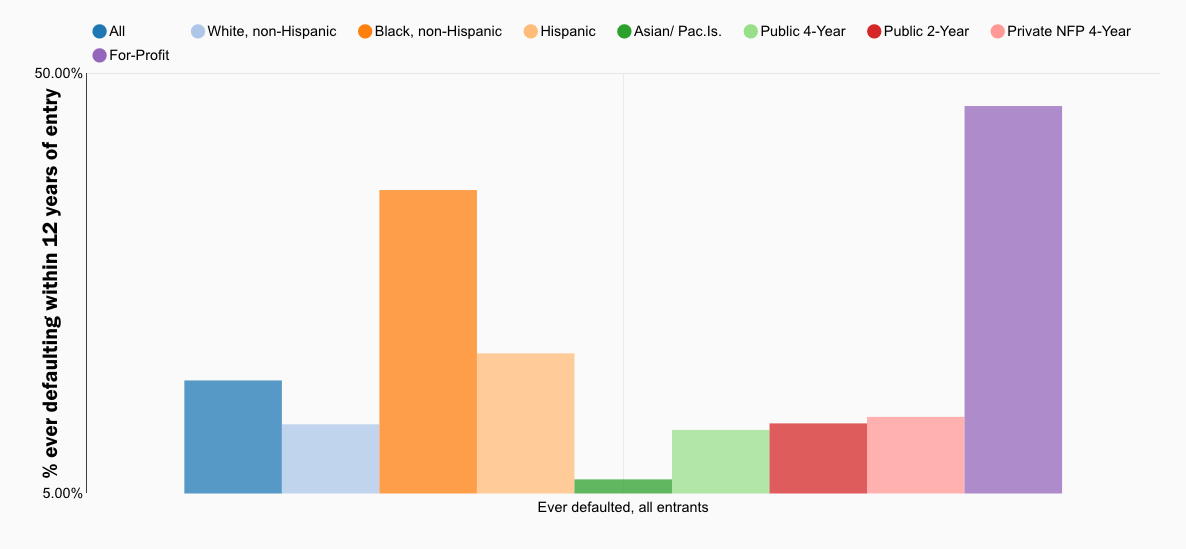
Source: Author’s calculations using NCES Power Stats with BPS-04 data with NSLDS supplement
Figure 2. Ever defaulted, by sector and race (Undergraduate borrowers only)
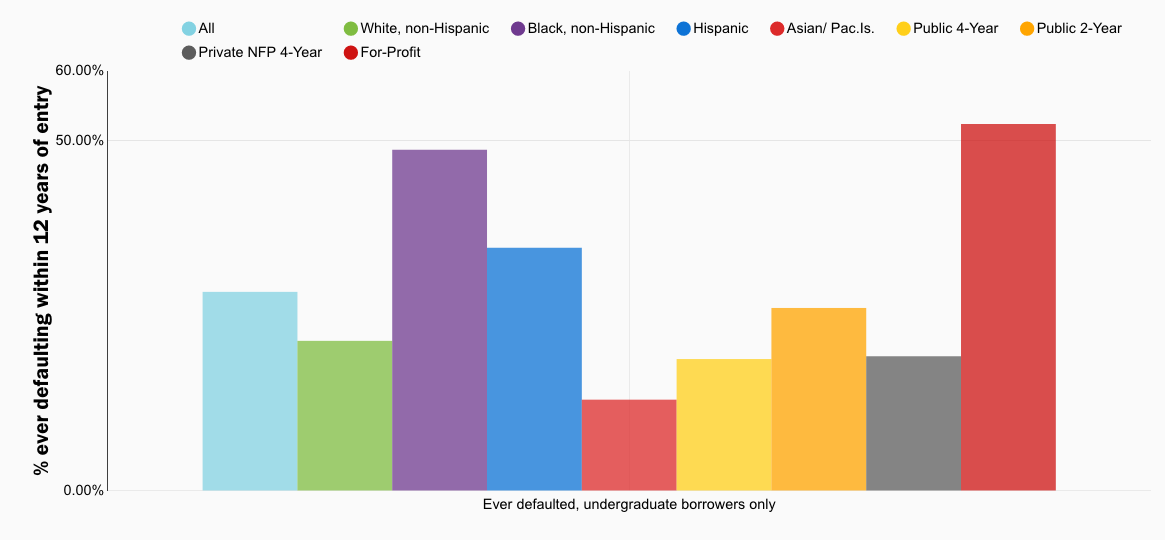
Source: Author’s calculations using NCES Power Stats with BPS-04 data with NSLDS supplement.
What accounts for patterns of student loan default by sector and race?
Institution sector and race/ethnicity are clearly important correlates of student loan default. But to what extent might these differences be explained by other student characteristics? And since these two factors are clearly not determinative, what other characteristics or experiences might help explain patterns of default, even for students within a given sector or of a given race/ethnicity? The goal of the analyses conducted below is not to attempt to identify “causal impacts” of given factors on default, but rather to better understand the constellation of factors that can or cannot explain the stark gaps across race and sector. For example, if racial or sectoral gaps could be explained fully by differences in degree attainment, policy attention might be best directed toward what happens during college than what happens after.
In order for a given factor to explain these gaps, two things must be true: the factor must be associated with likelihood of default, and the prevalence of the factor must differ across groups. Prior work has identified a range of factors predicting default, many of which are not terribly surprising. In addition to institutional sector and race, students’ age and gender, parental income and education, degree attainment, prior credit scores, and labor market outcomes are all related to default. [3]
One well-documented result that many do find surprising is that the amount of debt students hold is if anything inversely related to default rates—that is, those with more debt are significantly less likely to default. [4] This pattern is driven by the fact that students with larger balances also tend to have much higher levels of attainment and earnings. [5] After controlling for attainment, prior work has found that the inverse relationship goes away, but the remaining correlation between debt size and default is still small and only weakly positive. [6]
Deming, Goldin, and Katz (2012) perform a similar analysis of sectoral gaps in three-year cohort default rates using institution-level data, and find that the gap between for-profits and other sectors cannot be explained by differences in student composition and other institution-level characteristics. [7] The new linkage of the student-level BPS data with the NLSDS provides the opportunity to examine the drivers of default for a relatively recent college entry cohort, over an extended period of time, and with the ability to consider an unusually rich set of survey and administrative variables as potential explanatory factors. Using the same data employed here, Kelchen (2018) finds that racial gaps in default cannot be fully explained by other factors, though I will include a more comprehensive set of measures. [8]
In order to understand what is driving sectoral and racial gaps in default rates, I first run a regression predicting the likelihood of ever experiencing a default within 12 years as a function of the richest set of predictors available. [9] I limit the sample to students who ever borrowed for undergraduate education. The full set of predictors included, along with their relationship to the likelihood of default, can be found in Appendix Table A1. In brief, the analysis includes:
• Student and family background characteristics. These characteristics, measured in the first year of enrollment, include race/ethnicity, gender, age and age-squared, whether the student was classified as dependent, EFC (this is a summary measure of financial need driven primarily by family income) [10], whether or not parents owned a home, parents’ highest level of education, whether parents provided financial support, SAT scores or equivalent when available, and an indicator for whether or not the student had a credit card in the first year of college.
• Undergraduate borrowing. The regression includes the total amount borrowed for undergraduate education, as well as this amount squared to allow for the relationship to be non-linear.
• Institution sector and selectivity. The regression includes indicators for whether the first institution was for-profit, public four-year, and private not-for-profit institutions, with public two-year entrants as the reference group. Four year institutions are additionally distinguished by level of selectivity.
• College performance and attainment. The regression includes indicators for the highest level of attainment at the time of the six-year follow-up survey (2009), including whether the respondent was still enrolled, and with BA/BS attainment as the reference group. I also include last known GPA as of the six year follow-up survey (this variable is primarily derived from student transcripts, not self-reports). [11]
• Measures of employment, earnings, and debt-to-income ratios. The regression includes self-reported employment and earnings (for those not still enrolled) at the time of the 6-year follow up (2009), as well as measures of monthly loan repayment amounts, and debt-to-income ratios. Unfortunately, the data do not include measures of employment or earnings beyond 2009.
Even as measures of correlation rather than causation, individual coefficients from these regressions should be interpreted cautiously, because some factors in the model are closely related to each other. When this happens, the model cannot always distinguish which of the related factors is driving the association.
The results confirm previously established patterns by race, institution sector, and attainment, as well as by measures of financial need (EFC), but also add some new details. For those with SAT or ACT score data, scores are not significantly related to default holding all else constant, but last known college GPA is, with each GPA point associated with an 8-percentage-point lower rate of default. Proxies for parental wealth—including parental homeownership, parental education, and how much financial help parents provided to students while enrolled—are significantly negatively related to likelihood of default, even after controlling for everything else in the model. For example, students whose parents owned their home at college entry are 3 percentage points less likely to experience a default holding all else constant.
Finally, the full model indicates default is still significantly negatively correlated with undergraduate borrowing and default (with an additional $10,000 of debt associated with a 4-point lower rate of default), even after controlling for other factors including attainment. [12] However, default is significantly positively correlated with debt-to-income ratios, highlighting the role of capacity to repay: a 10 point increase in this ratio associated with a 2-points higher rate of default. [13] One surprising result is that being employed in 2009 is positively associated with defaulting within 12 years. This could be because those not employed in 2009 are more likely to acquire further education and have less time in repayment.
Can these factors explain institutional and racial/ethnic gaps in student loan default?
I next examine the extent to which the dramatic disparities in default rates by sector and race can be explained by differences in student/family background, amounts borrowed, college achievement and attainment, and post-college earnings and employment. To do this, I run a series of regressions similar to above, but adding predictors step-by-step in groups. For example, to examine disparities in default by sector, I first run a probit regression including only a set of indicators for institution type. The resulting coefficients describe the unadjusted differences in default rates by sector, as compared with the default rate in the reference group (in this case public two-year institutions). I then add additional predictors in the groups described above and evaluate how much the coefficients on the sector indicators change.
The results for institution sector are summarized in Figure 3 (full regression results are available in Appendix Table A2). The first set of columns shows the unadjusted gaps in default rates for undergraduate borrowers from each sector, as compared with the rate for borrowers who entered public two-year colleges (26 percent). The second set of columns shows how the gaps change after adding student and family background characteristics. Interestingly, while four-year college borrowers have lower unadjusted default rates than public two-year college borrowers, this advantage is completely eliminated after accounting for differences in student and family background across sectors. The for-profit disadvantage shrinks, but at 14 percentage points still remains large and statistically significant.
Figure 3. Sectoral differences in default rates (Undergraduate borrowers only)
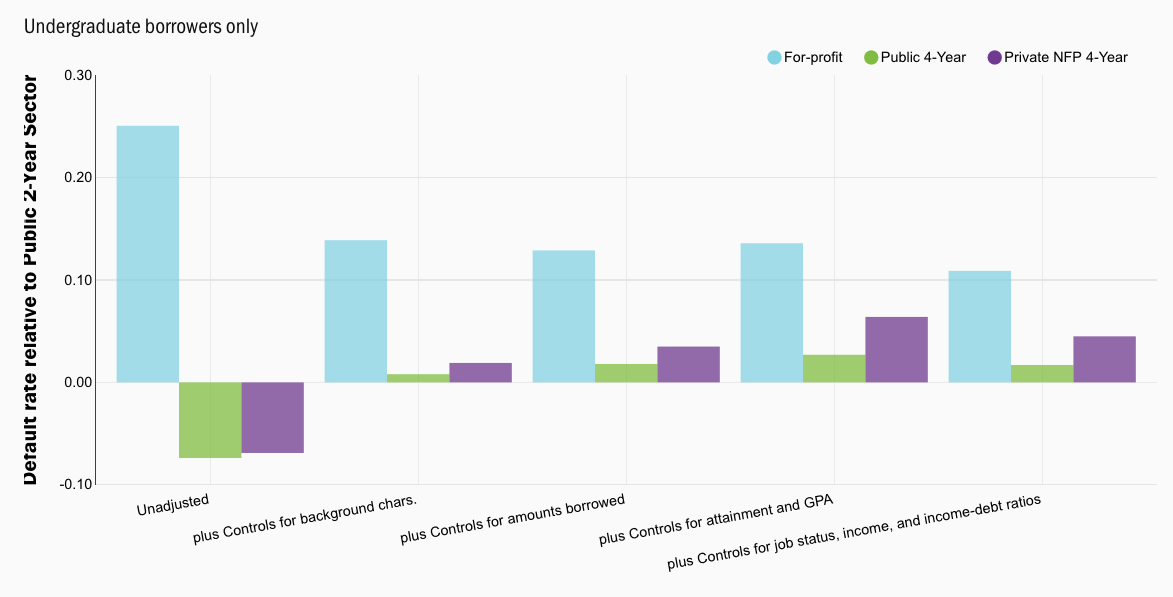
Source: Author’s calculations using restricted-use BPS-2004/09 data with NSLDS loan supplement. Coefficients are from a probit regression and are expressed as average marginal effects. See Appendix Tables A2 and A3 for full results.
Figure 4. Racial/ethnic differences in default (Undergraduate borrowers only)
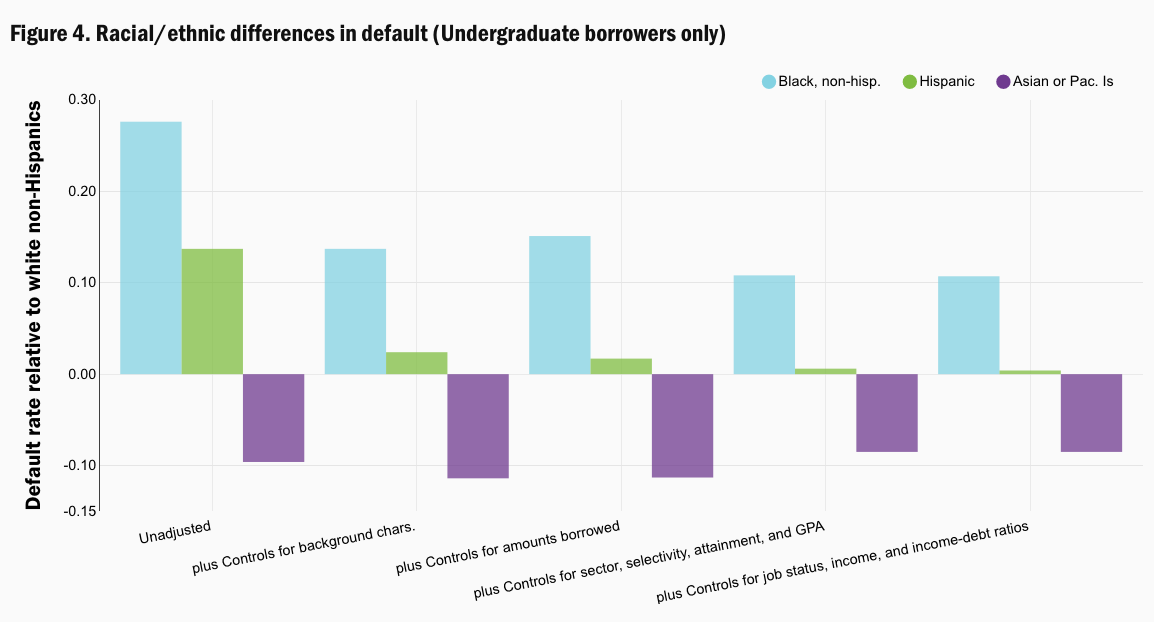
Source: Author’s calculations using restricted-use BPS-2004/09 data with NSLDS loan supplement. Coefficients are from a probit regression and are expressed as average marginal effects. See Appendix Tables A2 and A3 for full results.
Adding additional controls for amounts borrowed, attainment, and GPA does little to further explain the for-profit disadvantage. [14] The richest model, including controls for employment in 2009 and debt-to-income ratios, shrinks the gap modestly to 11 percentage points, but if for-profit entrants have lower employment and earnings than other borrowers with similar characteristics, this could well be a consequence of for-profit enrollment rather than a mitigating explanatory factor.
In Figure 4, I repeat the same exercise to examine racial disparities. The first set of columns shows the differences in default rates by race/ethnicity, as compared with the rate for white non-Hispanic borrowers (21 percent). [15] The second column accounts for additional student and family background measures that may differ by race. Adding these measures explains about half of the black-white gap and more than 80 percent of the Hispanic-white gap, but none of the white-Asian gap. Accounting for differences in amounts borrowed has little additional effect. Accounting for sector, selectivity, attainment, and GPA reduces the measured black-white gap a bit further. Interestingly, accounting for job status and debt-to-income ratios hardly changes the black-white gap at all after everything else is included. The richest model still leaves a large, statistically significant 11 percentage point black-white gap in likelihood of default, while the adjusted gap between white borrowers and those of Asian or Pacific Islander descent is 9 percentage points.
Some important caveats are required for interpretation. First, because many predictors are correlated with each other, the order in which predictors are added matters. Attainment and earnings may have relatively little additional explanatory power, not because they don’t matter, but simply because their effect has already been captured by other variables. In fact, in results not shown, I find that differences in sector, selectivity, and attainment, if added on their own, can explain almost half the black-white gap. [16] Second, predictive models are only as good as the measures that are included, and additional or more precise measures might reduce gaps further. [17] The 2009 measures of employment and income, in particular, are less than ideal because they are self-reported at a time when many in the sample have not yet entered repayment, and many are still enrolled in school. [18]
Finally, while the adjusted and unadjusted gaps presented here provide distinct information, one is not necessarily more correct or more useful than the other. For example, even if the black-white gap in default could be fully explained by family income and wealth, this would not make it any less problematic for black borrowers who cannot change their family background. Moreover, borrowing, degree attainment and earnings are themselves potential functions of race and/or institution sector. To the extent that controlling for these factors reduces the gap in default, it simply shifts the question to why there are gaps in these predictors.
What happens to defaulters after a default?
The high rates of default among black borrowers and those attending for-profit colleges is cause for concern due to the potential financial ramifications of default. When a student loan enters default, the entire balance becomes immediately due, and borrowers lose access to options that might otherwise have applied, such as deferment and forbearance. [19] If the borrower does not make arrangements with their servicer to get out of default, the loan may go to collections. Fees of up to 25% of the balance due may be added as a result. [20] Defaulting on a student loan can also lower credit scores, making it harder to access credit or even to rent an apartment in the future. In some states, default can lead to revocation of professional licenses, and credit histories may be evaluated as part of employment applications, making it harder to find or keep a job. Also, students cannot receive any additional federal student aid while they are in default, making it more difficult to return to school.
Still, default is a status, not a permanent characteristic, and many students who experience a default do eventually emerge from it. In fact, more than half of those of those who ever defaulted (54 percent) were able to resolve at least one of those defaults by the end of the 12-year follow up, and at least 14 percent returned to school after a default. [21] There are four ways to get out of default: rehabilitation, consolidation, paying in full, or having a loan discharged.
Rehabilitation offers the advantage of having the default removed from the borrower’s credit record, but it requires successfully making 9 payments over 10 months, and can only be used once. Consolidating defaulted loans into a new loan can get a borrower out of default more quickly and may be the only feasible option for those with multiple defaulted loans, but the default remains on the credit record for up to 7 years.
Figure 5 shows the percentage of defaulted students who were ever able to successfully resolve a defaulted loan by the end of the 12-year follow up, as well as the percentage ever emerging from default via one of these pathways, by race/ethnicity. Though black borrowers have a much higher rate of default in the first place, black and white defaulters emerge from default at similar rates, while Hispanic defaulters were slightly more likely to resolve a default. [22] At the end of the follow-up period, about 54 percent of white defaulters had resolved at least one defaulted loan, compared to 53 percent of black defaulters.
Figure 5. Ever resolved via a given method, by race/ethnicity (Undergraduate borrowers only)
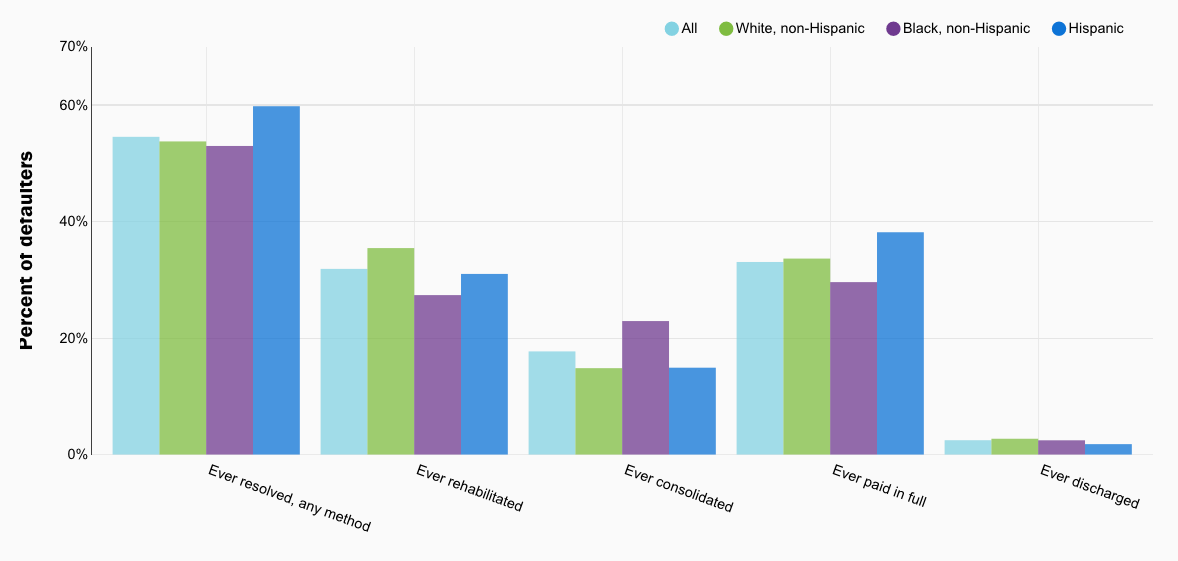
Source: Author’s calculations using NCES Power Stats with BPS-04 data with NSLDS supplement.
Black and white defaulters differ, however, in how they emerge from default: black defaulters are more likely to get out of default via consolidation (23 versus 15 percent), while white defaulters are more likely to rehabilitate (32 versus 26 percent) or pay in full (34 versus 30 percent). [23] Since rehabilitation can only be used once, I also examine patterns of resolution for the first defaulted loan (not shown), and find that the same general pattern holds.
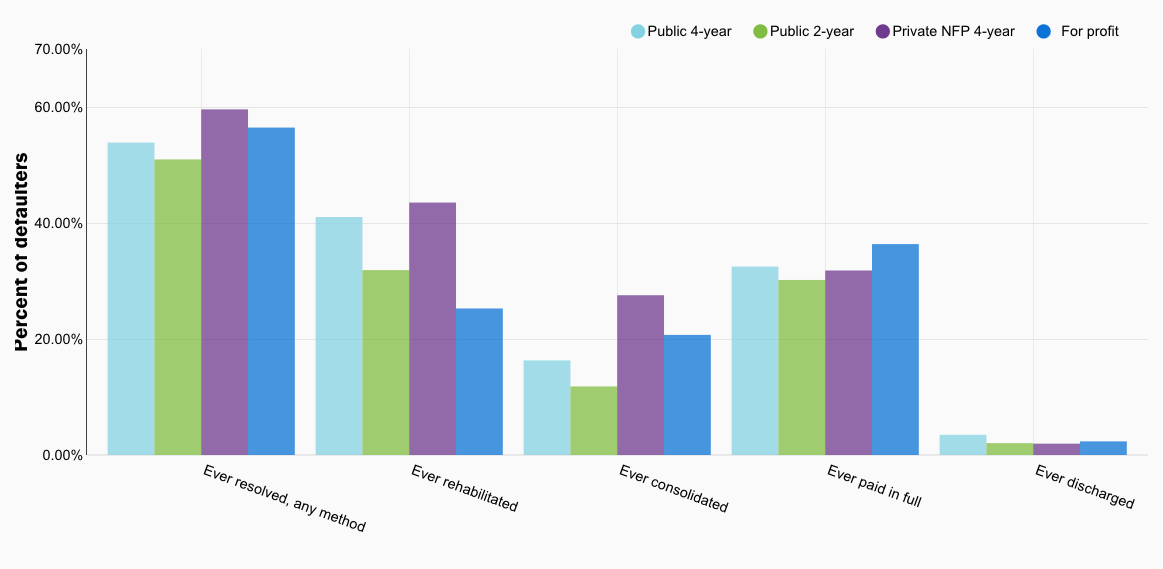
Figure 6 shows the same statistics for defaulters by first institution sector. Defaulters from private institutions—whether for-profit or not-for-profit—were more likely to resolve a default than defaulters from public institutions. These defaulters were also more likely than those from public institutions to resolve via a consolidation. Again, this pattern also holds if I examine only the first defaulted loan.
Figure 6. Ever resolved via a given method, by entry sector (Undergraduate borrowers only)
Source: Author’s calculations using NCES Power Stats with BPS-04 data with NSLDS supplement.
Future work could apply methods similar to those used above in order to better understand the predictors and consequences of consolidation versus rehabilitation among defaulted borrowers. Preliminary analysis (not shown) indicate that defaulters that resolve their first defaulted loan via consolidation have larger total balances at the time of default than those who rehabilitate ($19,185 versus $17, 124), are more likely to have experienced multiple instances of default (56 percent versus 41 percent), and more likely to receive federal student aid post-default (26 percent versus 14 percent). [24] While the interpretation of these findings is not fully clear, it is consistent with consolidation being the more appealing option for defaulted borrowers with multiple defaulted loans, and also for defaulters who seek to re-enroll in college (since consolidation can happen more quickly than rehabilitation).
Take-away findings and implications
A number of key findings emerge from this analysis. First, about half of the total black-white gap in default rates, and just under half of the gap between for-profits and public two-year colleges, can be explained by student and family background including measures of parental wealth and support. Second, adding additional controls reduces both gaps further; yet even controlling for degree attainment, GPA, and measures of 2009 employment, earnings, and debt-to-income ratios cannot fully explain either gap. Finally, more than half of defaulted borrowers are able to resolve at least one of their defaulted loans within the 12-year follow-up window, with black defaulters and those from private institutions more likely than other groups to resolve via consolidation.
Adjusted and unadjusted gaps both provide important information; one is not more “correct” than the other. The adjustments are only as good as the measures included, and because some of the predictors are correlated with each other, the order in which groups of predictors are added can matter. For example, differences in college sector, selectivity, and attainment explain more of the black-white gap in default when these predictors are added prior to adding student/family background characteristics.
What could explain the remaining gaps in default? Better measures of income and other post-college financial factors would further explain the gap, as might more information about the timing of when students left school and when they entered repayment. Some of the remaining gap may relate to the quality of loan exit counseling or loan servicing, which could vary by race or sector. Indeed, other research has found significant variation in repayment outcomes across the individual loan servicing agents that communicate with borrowers. [25]
This report also shows that more than half of defaulted borrowers are able to resolve at least one of their defaulted loans, though resolution does not necessarily erase the consequences of default. Conditional on experiencing a default, the likelihood of resolution does not vary by race, but those who attended private institutions (whether for-profit or not-for-profit) are more likely to resolve a defaulted loan. The pathway to resolution varies both by race and sector: compared with other students, consolidation is more common for black defaulters and those from private institutions.
A final caveat is that this report has focused on default rather than repayment. Just because a student is not in default, does not necessarily mean they are paying down their loan. And while defaults may be of greatest consequence to borrowers, repayment rates are a legitimate concern for policymakers and taxpayers. A similar analysis of predictors of successful repayment would further enrich our understanding of student loan outcomes. Qualitative research to illuminate how students transition from school into repayment, and so often into default and then back out again, would also be very valuable. The better we can understand what drives these patterns, the better policymakers can target their efforts to improve student loan outcomes.
— Judith Scott-Clayton
 Judith Scott-Clayton is Associate Professor of Economics and Education at Teachers College, Columbia University
This post originally appeared as part of Evidence Speaks, a weekly series of reports and notes by a standing panel of researchers under the editorship of Russ Whitehurst.
The author(s) were not paid by any entity outside of Brookings to write this particular article and did not receive financial support from or serve in a leadership position with any entity whose political or financial interests could be affected by this article.
Notes:
1. I apply the sample weight WTA000 to all analyses.
2. This excludes a small number of borrowers who borrowed for graduate school, but not for undergraduate education.
3. For a review of this literature through 2008, see Jacob PK Gross, Osman Cekic, Don Hossler, and Nick Hillman (2010), “What matters in student loan default: A review of the research literature.” Journal of Student Financial Aid 39, no. 1: 19-29. For an analysis of predictors of default and repayment at the institutional level, see Robert Kelchen and Amy Y. Li. (2017), “Institutional Accountability: A Comparison of the Predictors of Student Loan Repayment and Default Rates.” The ANNALS of the American Academy of Political and Social Science 671, no. 1: 202-223. For an analysis of credit scores and student loan defaults, see Alvaro Mezza and Kamila Sommer (2015), “A Trillion Dollar Question: What Predicts Student Loan Delinquencies?,” Finance and Economics Discussion Series 2015-098. Washington: Board of Governors of the Federal Reserve System.
4. Meta Brown, Andrew Haughwout, Donghoon Lee, Joelle Scally, and Wilbert van der Klaauw (February 19, 2015), “Looking at Student Loan Defaults through a Larger Window,” Liberty Street Economics Blog, New York: Federal Reserve Bank of New York; Susan Dynarski (January 7, 2016), “The trouble with student loans? Low earnings, not high debt,” Evidence Speaks, Washington, DC: Brookings; Adam Looney and Constantine Yannelis (2015), “A crisis in student loans? How changes in the characteristics of borrowers and in the institutions they attended contributed to rising loan defaults,” Brookings Papers on Economic Activity, Washington, DC: Brookings. Mezza & Sommer (2015).
5. Mezza & Sommer (2015); Looney & Yannelis (2015).
7. Deming, David J., Claudia Goldin, and Lawrence F. Katz. “The for-profit postsecondary school sector: Nimble critters or agile predators?.” Journal of Economic Perspectives 26, no. 1 (2012): 139-64. They find a much smaller gap between for-profits and other sectors to begin with (only about 5 percentage points higher than public two-year colleges and 11 points higher than public four-year colleges), likely because the three-year cohort default rate does not capture defaults that occur beyond the three-year window or that occur but are resolved within the window.
8. Robert Kelchen (February 13, 2018), “Examining Long-Term Student Loan Default Rates by Race and Ethnicity,” https://robertkelchen.com.
9. The results presented are average marginal effects from a probit regression. Probit regression is a regression method suitable for predicting binary outcomes such as the probability of default. The average marginal effects from a probit regression measure how much the probability of default changes, on average, for a one-unit increase in a given predictor holding everything else constant. In sensitivity analyses not shown here, I also ran linear probability models using ordinary least squares (OLS) regression. The resulting findings were qualitatively similar, but the probit regressions explain slightly more of the variation in default rates as compared with OLS models.
10. The EFC is taken from administrative FAFSA records for those that filed a FAFSA. For those not filing a FAFSA, the EFC is imputed by BPS using self-reported information.
11. College major is another factor suggested by the prior literature. In results not shown here, I found that while certain majors are associated with higher default rates, differences in choice of major do little to explain either racial or sector gaps after accounting for the other factors in the model.
12. The model also indicates a significant positive correlation of default with cumulative borrowing squared, implying that the negative correlation is slightly weaker at higher levels of debt. Going from zero to $10,000 of debt is associated with a 4.4-point lower rate of default. At the mean level of undergraduate debt ($10,127), an additional $10,000 of undergraduate debt is associated with a 3.8-point lower rate of default.
13. In an effort to maximize the predictive power of the regression (important for subsequent analyses in this report), I include some measures which are tightly related, making it difficult to interpret some measures such as income, undergraduate borrowing, and debt-to-income measures in isolation. When debt and debt-to-income ratios are included, income on its own is negatively, but not significantly related to default, but its role may be primarily picked up via the debt-to-income measure. When I include each of these three measures without including the other two, the coefficients on each are magnified and statistically significant.
14. Note that I exclude selectivity indicators from this set of models, as they are tightly linked with institution sector.
15. Students identifying as multiple race/ethnicities, other race/ethnicity or unknown are included in the model with a separate indicator, but their results are not reported here due to small sample size.
16. In other results not shown, I find that for the gap between for-profit and public two-year college entrants, adding earnings, attainment, and borrowing without student and family background characteristics explains a little less than one-quarter of the overall gap.
17. The R-squared from an OLS regression using the full model in Appendix Table A1 is 0.24. With binary dependent variables, the R-squared from OLS regression can be interpreted as the difference in average predicted default rates between those who actually defaulted and those who actually did not (Gronau,1998). Thus, borrowers who actually defaulted had a predicted default rate 24 points higher than those who did not default (a perfect model would have an R-squared of one, though in practice an R-squared of 0.24 is quite good for a binary outcome variable).
18. Indeed, even if I add the earnings/employment measures on their own, they still explain relatively little of the gaps either by sector or by race, suggesting their limited role is not only because of the other measures in the model. In order to include this as a predictor in the model, those still enrolled in school are assigned an income of zero and the model includes a separate indicator for those still enrolled in school.
19. Information on what happens after a default is summarized by the U.S. Department of Education here: https://studentaid.ed.gov/sa/repay-loans/default/collections.
20. Collection costs policies as summarized by the U.S. Department of Education: https://myeddebt.ed.gov/borrower/collectionCostsNavigate.
21. Specifically, 14 percent of defaulters received federal Pell grants or new student loans after a default. Other students may have returned to school without receiving federal aid.
22. Sample sizes were too small for defaulters of Asian/Pacific Islander descent to include in this figure.
23. Note that because borrowers may default multiple times or on multiple loans, the percentages describing pathways out of default add up to more than the total percentage no longer in default. Some defaulters may use more than one pathway, and some of those that use a pathway previously may re-default and still be in default at the end of the follow-up.
24. I treat defaults that occurred in the same month as one instance of default.
25. Daniel Herbst (2018), “Liquidity and Insurance in Student Loan Contracts: Estimating the Effects of Income-Driven Repayment on Default and Consumption,” unpublished manuscript, Princeton University.