In spite of Tea Party criticism, union skepticism, and anti-testing outcries, the campaign to implement Common Core State Standards (otherwise known as Common Core) has achieved phenomenal success in statehouses across the country. Since 2011, 45 states have raised their standards for student proficiency in reading and math, with the greatest gains occurring between 2013 and 2015. Most states set only mediocre expectations for students for nearly 10 years after the passage of the federal No Child Left Behind Act (NCLB). Now, in the wake of the Common Core campaign, a majority of states have made a dramatic move forward.
Common Core State Standards
 In 2009, with funding from the Bill & Melinda Gates Foundation, the National Governors Association and the Council of Chief State School Officers formed a consortium that established Common Core. Put simply, the standards outlined what students should know and be able to accomplish at each grade level in reading and math.
Eventually, 43 states and the District of Columbia fully adopted Common Core, while one other state, Minnesota, adopted only the reading standards. Although much of the debate surrounding Common Core has focused on the nature of the curriculum for each grade level, proponents have also sought to raise the proficiency level on tests that assess student learning. In fact, one of the consortium’s central goals has been to encourage states to set their proficiency standards on par with those set internationally.
To motivate states to adopt Common Core standards, the U.S. Department of Education provided incentives in 2009 via its Race to the Top initiative. The department announced a competition that would award grants totaling more than $4.3 billion to states that proposed to undertake reforms drawn from an extensive list provided by the department. Adopting “college-and-career-ready” standards was among the recommended reforms. All but four states submitted Race to the Top proposals, and 18 states and the District of Columbia received awards.
Subsequently, the Department of Education further encouraged states to adopt Common Core by offering waivers from NCLB requirements, which many states had found increasingly onerous, in exchange for pursuing department-approved alternatives similar to those suggested as part of Race to the Top.
The priority given to Common Core by both Race to the Top and the waiver program provoked outcry among some conservatives, who feared that the national standards would both undermine local control of schools and lower expectations for students. “The Common Core national math standards are not ‘internationally benchmarked,’ … not world class and competitive with the best … and not ‘second to none’ (though advertised as such when announced),” testified Hoover Institution researcher Williamson Evers before the Ohio legislature. Similarly, Jamie Gass at the Pioneer Institute in Boston declared, “Common Core is dumbed down.”
Meanwhile, teachers unions also expressed trepidation that Common Core standards would be used to assess teachers, especially since test-based evaluations of teachers ranked high on the Race to the Top agenda. The District of Columbia Public Schools, for example, had introduced such evaluations over heavy union opposition, and teachers unions across the country mobilized against accountability systems that leveraged statewide tests as a basis for evaluating their members.
With opposition mounting in both liberal and conservative circles, support for Common Core slipped significantly among the public at large, casting doubt on its very viability. But despite staunch political dissent, a careful look at proficiency standards reveals that most states have delivered on their commitments to tighten them.
Measuring State Proficiency Standards
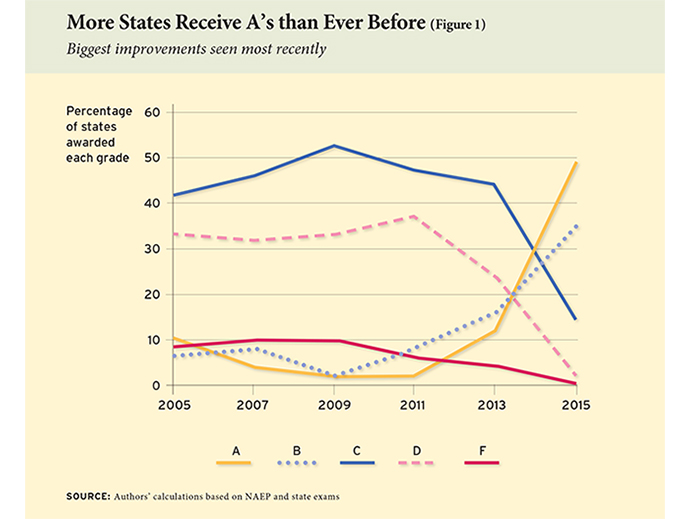
Beginning in 2005, Education Next has published the grades given to state proficiency standards on an A-to-F scale designed by researchers in the Program on Education Policy and Governance (PEPG) at Harvard University. In 2005, only six states received an “A,” while just three states earned this distinction as recently as 2011. In 2015, however, 24 of the 49 states (including the District of Columbia) for which data were available as of mid-January 2016 earned an “A.” Meanwhile, the number of states receiving a “D” or an “F” has dwindled from 17 and 13 in 2005 and 2011, respectively, to a grand total of 1 in 2015 (See Figure 1). In short, state standards have suddenly skyrocketed.
State proficiency standards were initially required when Congress passed NCLB in 2002. Under that law and continuing under its successor, the Every Student Succeeds Act (ESSA), the U.S. Department of Education has required states to test students in math and reading in grades 3 through 8 and again in high school. States must also set the performance level that students must reach on the exams to be identified as “proficient.” States report proficiency rates for each school as well as for the state as a whole. Importantly, each state chooses its own tests and establishes its own proficiency bar.
Federal law also mandates the periodic administration of tests in selected subjects to a representative sample of students in 4th and 8th grade as part of the National Assessment of Educational Progress (NAEP), often called “the nation’s report card.” The performance levels that the NAEP deems as proficient are roughly equivalent to those set by international organizations that estimate student proficiency worldwide.
Data from both the NAEP and state tests allow for periodic assessments of the rigor of each state’s proficiency standards. If the percentage of students identified as proficient in any given year is essentially the same for both the NAEP and the state exams, we can infer that the state has established as strict a proficiency standard as that of the NAEP. But if the state identifies a higher percentage of students as proficient than the NAEP, we can conclude that the state has set its proficiency bar lower than that of the NAEP.
To be clear, high proficiency standards do not necessarily reflect high student performance. Rather, good grades suggest that states are setting a high proficiency bar—that students must perform at a high level to be deemed proficient in a given subject at their grade level. Grades gauge “truth in advertising” by indicating the degree to which states inform parents of how well their students are doing on an internationally accepted scale.
Dramatic Rise in Standards
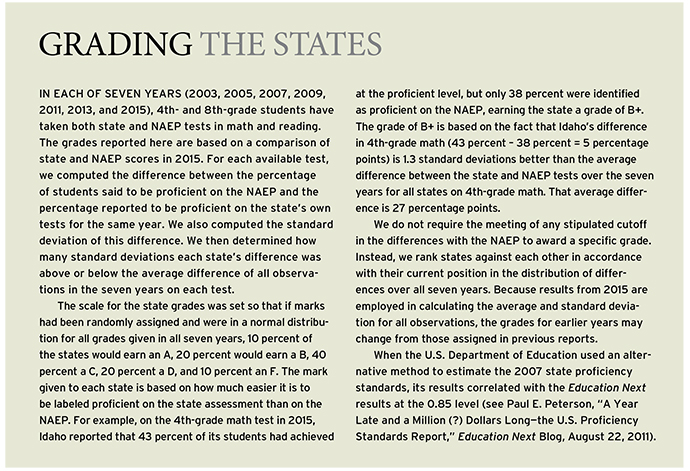
Education Next has evaluated the rigor of state proficiency standards each time results from both state and NAEP tests have been available for the same year. This is the seventh in a series of reports that grade state proficiency standards on the traditional A-to-F scale (see www.educationnext.org/edfacts for a complete list of these reports). Each state earns a grade according to the size of the difference between the percentages of students identified as proficient by state and by NAEP exams in 4th- and 8th-grade math and reading.
Previous reports (most recently “States Raise Proficiency Standards in Math and Reading,” features, Summer 2015) show that states, on average, established proficiency benchmarks that were much lower than those set by the NAEP and that state standards varied widely. Furthermore, prior reports revealed that until 2011, states did not markedly increase their proficiency standards nor did the variation among the states narrow. If anything, trends drifted in the opposite direction.
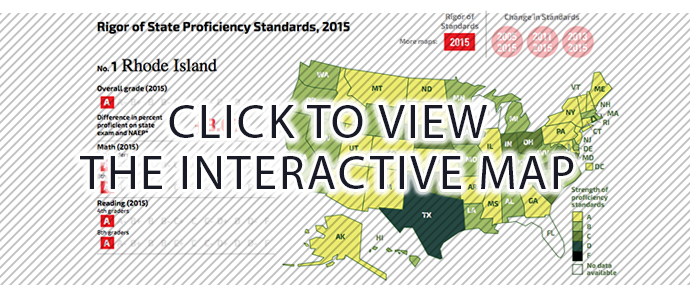
In Table 1, we report a grade for each state for each of four tests (4th-grade math, 4th-grade reading, 8th-grade math, and 8th-grade reading). An average of the underlying scores generating these grades determines the overall grade for the state. (The differences between state and NAEP proficiency rates, as well as the changes in state standards over time, are shown in an interactive graphic available at www.educationnext.org/edfacts). Table 1 also shows changes in standards over three time periods: a) 2013–2015, b) 2011–2015, and c) 2005–2015.
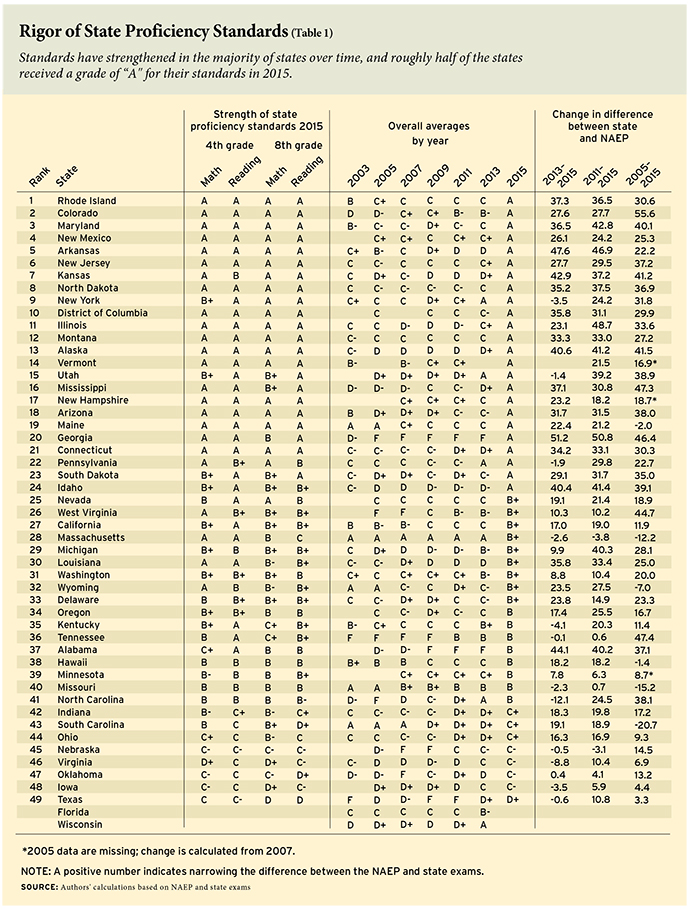
The results are striking: The last two years have witnessed the largest jump in state standards since they were established as part of the federal accountability program. Overall, 36 states have strengthened their standards since 2013, while just 5 have loosened them, and 7 have left their standards essentially unchanged. In short, the Common Core consortium has achieved one of its key policy objectives: the raising of state proficiency standards throughout much of the United States.
Even more remarkable is that states are earning higher grades even though it was harder to get an “A” in 2015 than ever before. Education Next grades the individual states on a “curve” that includes all observations from all years dating back to 2003. Until now, state standards had changed so slightly from one year to the next that the curve made little difference. Yet so many states raised their standards before the 2015 administration of state tests that every state in every year is being evaluated on a tougher scale. As a result, some states that, for example, obtained an “A” in previous studies have been downgraded to a “B+” in 2015.
The table and the interactive graphic on the Education Next website display the grades under the tougher grading system that has evolved because so many states have raised their standards. In the text, however, we refer to grades as originally earned in prior years. This yields slight discrepancies between the two metrics (see sidebar below, “Grading the States”). Note that the curve does not affect the estimates of the percentage difference in state and NAEP proficiency standards reported in the three right-hand columns of Table 1. These columns reveal the exact estimate of the change in proficiency standards for all states for which data are available.
One should keep in mind that participation rates can affect our estimates. Proficiency standards may appear more rigorous than they actually are if lower-performing students are more likely to participate in state testing, but less rigorous if higher-performing students are more likely to participate (assuming that NAEP samples are representative of all students). In 2015, advocates sought to persuade parents in a number of states—including New Jersey, New York, Illinois, Colorado, and California—to “opt out” of statewide tests. The opt-out movement seems to have been particularly successful with high school students. New Jersey, for example, reports that its highest nonparticipation rates occur among juniors in high school. Our estimates are based on the performances of 4th and 8th graders, making them less susceptible to bias from opt-out activity. We are currently unable to estimate patterns of participation in the opt-out effort, but to the extent that many students who opted out were potential high scorers, proficiency standards may be lower than our calculations suggest.
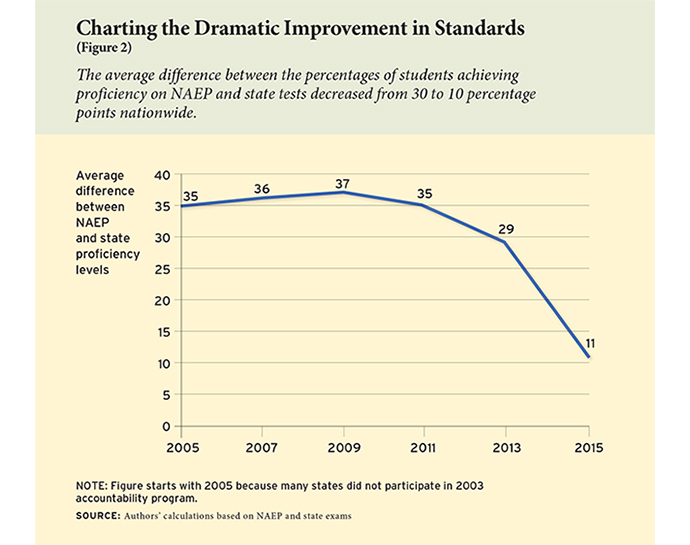
Reaching for an “A”
In 2015, 24 of 49 states (including the District of Columbia) earned an “A” grade. Since 2013, the average difference between NAEP and state proficiency levels has plummeted from 30 percent to 10 percent, representing a dramatic improvement over the previous two-year period (2011–2013), in which the difference dropped only 5 percentage points, from 35 percent to 30 percent (see Figure 2). Clearly, states are tightening standards more than ever since NCLB took effect. As mentioned earlier, no fewer than 36 states have raised their proficiency standards over the past two years, while just 5 relaxed them. Forty-five states have boosted their standards since 2011.
In 2015, the following 24 states earned an “A” grade: Alaska, Arizona, Arkansas, Colorado, Connecticut, District of Columbia, Georgia, Idaho, Illinois, Kansas, Maine, Maryland, Mississippi, Montana, New Jersey, New York, New Hampshire, New Mexico, North Dakota, Pennsylvania, Rhode Island, South Dakota, Utah, and Vermont. In 2013, nine states earned an “A,” but of these, only New York, Pennsylvania, and Utah remain in the elite group in 2015. The standards for five of the other six high scorers from 2013—Kentucky, Massachusetts, Missouri, North Carolina, and Tennessee—are among those that slipped in 2015. North Carolina, however, is the only state where the downslide (12.1 percentage points) exceeds 5 percentage points.
The slippage in Massachusetts suggests the importance of viewing proficiency standards in context. In 2015, the state allowed local school districts to choose between the established test, the Massachusetts Comprehensive Assessment System (MCAS), or a newly developed test from the Partnership for Assessment of Readiness for College and Careers, dubbed the PARCC. To preserve continuity with prior testing, we report results for the MCAS. The percentage of 8th graders identified as proficient on the MCAS, however, is much higher than the percentage identified as proficient on the PARCC. This could be because PARCC standards are higher, or it may simply be that a greater number of high-performing districts chose to retain the MCAS. The state department of education promises to provide more specific information on the students taking the two tests.
The lowest grade, a “D+,” goes to Texas. Four years ago, the Texas Department of Education promised to set in place a staircase that would result in gradual increases in the state’s standards. The Texas commissioner of education at that time, Michael Williams, said the “approach is intended to minimize any abrupt single-year increase in the required … standard for this school year and in the future.” By 2015, however, Texas had yet to move beyond the first step of the stairs, though it promises to do so in 2016. According to officials, the purpose of the delay was to give teachers and students sufficient time to adjust to more-rigorous standards.
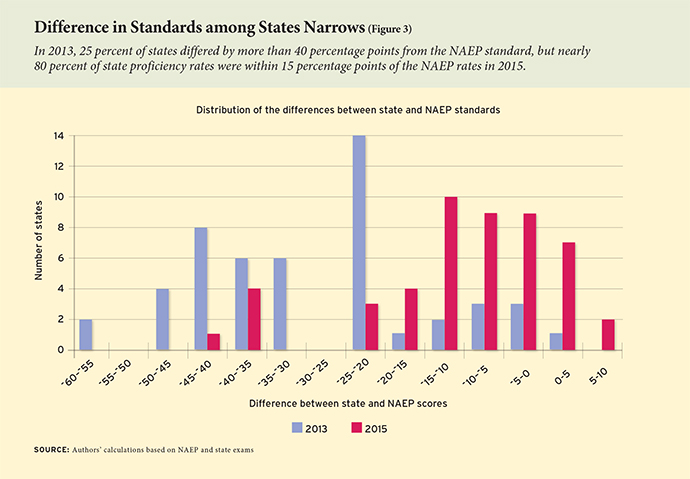
State Standards Converge
Not only have standards risen across the country, but the differences in standards among the states narrowed considerably between 2013 and 2015. Figure 3 shows the distribution of the states according to how much they vary from NAEP on the proficiency standard. The 2013 distribution varies widely, while the 2015 distribution is clustered around the NAEP standard. In 2015, the range between the highest- and the lowest-performing state was less than 50 percentage points, as compared to nearly 65 percentage points in 2013. Even more impressive, nearly 80 percent of the states’ proficiency rates are within 15 percentage points of the NAEP rates, with only one state possessing an average proficiency rate differing from the NAEP standard by more than 40 percentage points. By comparison, 25 percent of states differed from NAEP by more than 40 percentage points in 2013.
Race to the Top
The rise in standards between 2013 and 2015 is not concentrated among states that received Race to the Top awards. We do not find that Race to the Top grant winners raised their standards more than other states (results not shown). This does not necessarily mean that Race to the Top was ineffective, however, as the remaining states later came under similar federal encouragement to raise standards when they sought waivers from NCLB requirements.
Not There Yet
Although the overwhelming majority of states have established standards that approximate international benchmarks, and no state set standards so low as to receive an “F” grade, seven states did earn a grade in the “C” range, and one a “D+,” indicating a substantial divergence from the NAEP. Although proficiency standards have climbed overall, an average difference of 10 percentage points remains between the state proficiency levels and the corresponding NAEP proficiency levels. Additionally, two states—Florida and Wisconsin—had yet to report test-score performances at the time the data for this report were prepared.
Since the inception of NCLB, the introduction of higher proficiency standards has been fraught with political controversy. With a rising proficiency bar, student performance appears lower even when it is the bar itself—not student performance—that has changed. Indeed, controversy rocked Florida and New York, two of the first states to raise their proficiency bars after 2011. Amid the furor, the state education commissioner in Florida resigned, and in New York, the tougher standards fueled the parental opt-out movement.
Such political storms might be avoided in the future because states no longer need to comply with many NCLB provisions. With the passage of ESSA, which has eliminated NCLB sanctions for most schools, states find themselves under less pressure to set lax proficiency standards. Previously, districts had strong incentives to resist high proficiency standards, as they feared their schools might be subject to increasingly severe penalties for not producing improved test results. Because most schools no longer need to worry about sanctions, the waivers from NCLB and the subsequent passage of ESSA may facilitate the increasing rigor of state standards.
If Common Core works as its proponents expect, higher proficiency standards could propel schools to achieve at more impressive levels and thus raise the nation’s ranking on international tests. Of course, it is imperative that parents, teachers, administrators, and policymakers recognize the low levels of student proficiency now being identified in most states as a serious warning that action is needed. Otherwise, raising the proficiency bars will be for naught. Still, it is a hopeful sign that standards have moved in the right direction. If student performance shifts upward in tandem, it will signal a long-awaited enhancement in the quality of American schools.
Paul E. Peterson, editor-in-chief of Education Next, is professor of government and director of the Program on Education Policy and Governance at the Harvard Kennedy School, where Samuel Barrows and Thomas Gift are postdoctoral fellows.
This article appeared in the Summer 2016 issue of Education Next. Suggested citation format:
Peterson, P.E., Barrows, S., and Gift, T. (2016). After Common Core, states set rigorous standards. Education Next, 16(3), 9-15.