After more than a decade of strict federal mandates and measures of school success, a new education law is inviting policymakers across the country to rethink “accountability.” The Every Student Succeeds Act (ESSA) takes a more comprehensive approach to assessing school quality than the No Child Left Behind Act (NCLB), moving beyond NCLB’s focus on annual test performance to also consider factors like student academic growth, graduation rates, and rates of proficiency for English language learners. The law also requires at least one additional measure of “School Quality or Student Success” (SQSS), such as student engagement, college readiness, or school climate. And it empowers states to design their own accountability systems, leaving behind the one-size-fits-all mandates of NCLB.
In California, we’ve moved beyond assigning schools a single number score each year and are implementing a “dashboard” accountability system, to better capture and communicate multiple dimensions of school performance. Such a dashboard can provide rich information and support the many functions that accountability systems serve: providing guidance to parents and educators on district and school strengths and weaknesses; identifying struggling schools; and supporting the design and implementation of assistance strategies.
Yet, while ESSA requires states to consider multiple measures, current draft regulations then call on us to crunch them into a single, summative rating to identify struggling schools. This practice not only runs counter to the spirit of multiple measures, it is bound to create inaccurate ratings and should not be part of the final regulations adopted by the U.S. Department of Education later this year. While it may be true that moving to multiple measures will pose a new challenge for education stakeholders at all levels, trying to summarize all of these dimensions into a single number score or A‒F letter grade will have misleading and negative consequences.
Simplicity, but at What Cost?
Single, summative ratings were in vogue over the past decade. The approach was pioneered in Florida, which began using letter grades for all its schools in 1999 under Governor Jeb Bush. Governor Bush played a role in spreading this idea to other states, and eventually 16 other states began to use the A‒F grading system, with many others using something similar. The simplicity of such ratings meant it was easy for parents and the public to sort and rank schools by the supposed strength of their performance.
California embraced this approach as well. For more than a decade, we used the Academic Performance Index (API), which was based solely on test scores and established 800 as proficient on a scale of 200 to 1000. It is not clear why 800 was the magic number for a school to be judged doing well, but API became the coin of the realm. The scores, along with an accompanying number ranking schools across the state from 1‒10, were promoted by web sites like GreatSchools.org, and became a marketing tool for real estate agents to sell houses in neighborhoods with “good” schools. Over time, it became clear that this kind of rating method punishes schools that serve disadvantaged communities; indeed, in California, the single score was so highly correlated with student demographics that it was sometimes referred to as the “Affluent Parent Index.”
California relied on the overly simplistic API until 2013. While the public accepted it, a school’s API only told parents, educators, and policymakers how students performed on English and math tests—an absurdly narrow view of school performance. Indeed, a primary impetus for the expanded measurement under ESSA was to move away from NCLB’s narrow view of student success: by establishing test scores as the “bottom line,” NCLB led many schools to focus exclusively on improving scores in tested subjects, which does not adequately prepare students to thrive in a competitive and complex global economy.
New research shows that summative scores like API are not only uninformative, they are inaccurate when it comes to identifying low-performing schools. It’s an important distinction, because ESSA requires that states designate their lowest-performing 5 percent of schools receiving Title I funds as in need of Comprehensive Support and Improvement (CSI), which triggers additional support and intervention. To determine which schools need CSI the most, it’s important to understand which schools are struggling the most. And now with multiple measures, understanding which schools have low performance is not as straightforward as when we were only measuring test scores, as uninformative as they may have been.
The study, by Policy Analysis for California Education (PACE), examines the potential effects of using single measures in California’s CORE districts, where multiple measures of school performance are included in annual accountability reports. The six CORE districts, which received a waiver under NCLB to develop their innovative, multiple-measures system, serve nearly one million students, nearly three-quarters of whom come from low-income families. The unique, locally driven accountability system focuses on academic outcomes alongside nonacademic indicators, including rates of chronic absenteeism, suspensions, and expulsions, and measures of school climate, culture, and students’ social-emotional skills.
The PACE report demonstrates that used independently, different academic measures would identify different schools as the lowest performers. For all but the lowest-performing 1 percent of schools (which struggle across the board), a single number will inevitably produce arbitrary judgments about which schools are “better” and “worse,” concealing the specific strengths and weaknesses of specific schools and depriving educators of the information that they need to improve.
The authors investigated the extent to which different academic measures—academic performance, academic growth, graduation, and English language proficiency—would identify similar schools if used independently. They found that schools in the bottom 5 percent on any given indicator differed dramatically from measure to measure. In elementary and middle schools, for example, many schools with low academic performance also demonstrate high growth relative to similar schools (Figure 1). Just 13 percent of those schools are identified among the bottom 5 percent by both measures. Given how differently these measures distinguish among schools, summing them up in a single number or grade is a serious error.

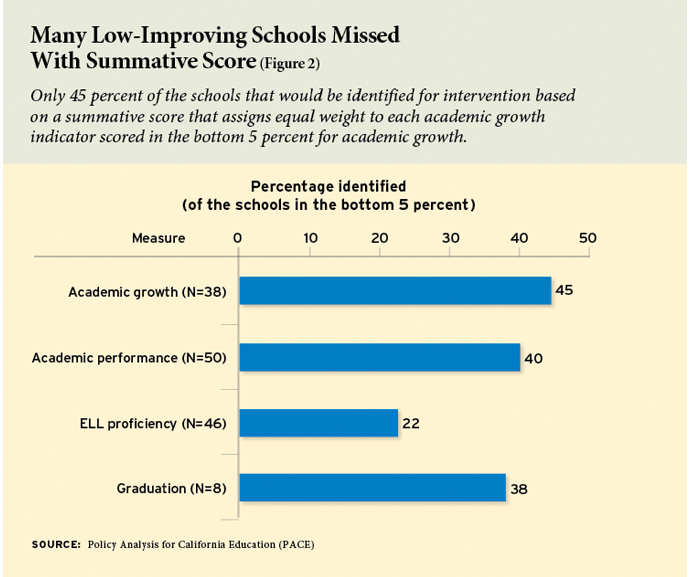
Most schools earn high scores in some areas and low scores in others, which means that a summative score, by definition, averages out this variation. PACE shows that an equally weighted summative score will identify schools that are low on all indicators, but will not identify many schools that are low on specific indicators. Among the studied schools, 2 percent are in the bottom 10 percent on all indicators, and all of them are identified using the summative measure. However, only 40 percent of schools in the bottom 5 percent for academic performance are identified for CSI using the summative measure (Figure 2). Similarly, only 45 percent of schools in the bottom 5 percent for academic growth are identified by the summative measure. For English language proficiency, it was 22 percent, and for graduation rates, it was 38 percent. By aggregating across measures that represent very different dimensions of performance, the summative score may not identify schools as low-performing if they are very low on just one measure, even if they are merely average, or even moderately low, on others.
Many Dimensions of Success
In addition to the academic indicators, ESSA specifies that states must include at least one indicator of “School Quality or Student Success” (SQSS). The CORE districts have already begun collecting a wide range of such indicators locally, and there is much to be learned from their experience about how such measures can be integrated into state systems. As with the four academic measures, schools do not often demonstrate low performance on multiple measures simultaneously, and there is a wide range in how the measures identify schools in the bottom 5 percent compared to one another and compared to the summative academic score. For example, in looking at rates of chronic absenteeism vs. rates of suspensions and expulsions, 90 schools identified as being in the bottom 5 percent of all schools by either measure, yet only 16 percent of those schools are similarly identified by both measures.
ESSA regulations specify that nonacademic measures cannot prevent a school from receiving a CSI designation that would otherwise have been identified using the academic measures. Given the difference between the nonacademic and the academic measures, this effectively forces states to assign SQSS indicators very little weight in a summative score, such that they do not change the identification of schools using the academic measures. We found that an SQSS measure would have to account for less than 1 percent of the summative measure to ensure it did not change which schools are identified for CSI. If the SQSS indicators are important signs of school performance, as the law suggests they are, they should be accorded a meaningful weight in the process of identifying schools for support and improvement. This suggests that a summative score is particularly problematic when considering the inclusion of SQSS measures in states’ accountability systems.
As an alternative, the PACE report shows how states can identify schools for CSI using a method that considers each indicator rather than aggregating the indicators into a summative score. Using a dashboard of measures, states could use a tiered approach to make a series of decisions about school performance on particular indicators. This would enable states to make judgments about whether or not schools need CSI based on a comprehensive evaluation of all the data. For example, instead of averaging or differently weighting scores on academic performance and academic growth, a state could decide to identify for CSI only schools that have low academic outcomes and are not demonstrating growth. Similarly, of two schools with similar academic achievement, a state could choose to focus limited resources for CSI on a school with poor SQSS outcomes rather than a school with positive SQSS outcomes, since the latter school may be on a road to improvement while the former is not.
It is much like a school counselor trying to decide which students to support with limited resources. Should she focus intensive support to a student with all Ds, or to a student with mostly Cs and Ds, and one F? Her decision reflects a value judgment, and may depend on other characteristics of the student. By the same token, the full information in the multiple measures is more informative than a single number.
The Strength of a Dashboard
There is growing agreement among policymakers, school and district leaders, and researchers that the most important use of school effectiveness measures should be in driving continuous improvement at both the local and state levels. To this end, California is developing a multiple measure, dashboard-style accountability system that is focused on providing schools and districts with a variety of data, for a more comprehensive picture of a school’s successes and challenges. Such detail captures multiple dimensions of school and district performance and can drive local improvement efforts tailored to each unique context. It can also help school and district officials better inform themselves and their communities about how specific programs and services are working to improve student outcomes. Sharing data in this way can simultaneously present a holistic view of how a school is doing and—with thoughtful visualization—highlight a limited number of metrics to focus attention and not be overwhelming to consumers.
In California, we believe parents, as educated consumers and advocates for their children, want to know more about how public schools are performing, and that policymakers should ensure the public has the necessary tools to make good use of multiple measures. Already, many parents intuitively understand that holding schools accountable for performance cannot be reduced to a single number, in the same way that they appreciate that their own students may be doing well in one subject but not another. Parents are familiar with multiple measures when they read their child’s report card, and certainly do not want their child’s school performance reduced to a single number.
In our view, a dashboard will give parents the information they need to make wise choices about the schools their children attend, rather than misleading them with arbitrary judgments about whether schools are “good” or “bad.” Focusing the accountability system on practical and actionable tools for continuous improvement comes with trade-offs in the ability to rank schools, but the benefits more than justify the costs.
Heather J. Hough is executive director of the research partnership between the CORE Districts and Policy Analysis for California Education (PACE). Michael W. Kirst is president of the California State Board of Education and professor emeritus of education and business administration at Stanford University.
This is part of a forum on state accountability systems. For an alternate perspective, see “Florida’s Intuitive Letter Grades Produce Results,” by Jeb Bush.
This article appeared in the Winter 2017 issue of Education Next. Suggested citation format:
Bush, J., Hough, H.J., and Kirst, M.W. (2017). How Should States Design Their Accountability Systems? Education Next, 17(1), 54-62.