
Executive summary
The Common Core Standards, or a close variant, are the standards of record in approximately 40 states. Once popular, the standards have seen their support decline on both the right and the left. Previous research suggests that Americans hold a number of misconceptions about the standards, and that these misconceptions are strongly related to their support or opposition.
We see misconceptions about policies as a need worth addressing. If the public does not understand a policy (or even worse, misunderstands it), they may accept or reject it based on misinformation. To begin to tackle this issue, we test an approach called a “refutation text” meant to correct people’s misconceptions about an issue. While refutation texts have been widely used to correct misconceptions about controversial science issues (e.g., global warming, GMOs), to our knowledge they have never been tested to correct misconceptions about policy.
We use a sample of respondents from Amazon’s Mechanical Turk and test the impact of a refutation text on respondents’ misconceptions about the standards. We also test whether the refutation text reduces partisan views about the standards. Finally, we follow up with participants one week later to see whether the effects persist.
Our data confirm that substantial misconceptions about the standards continue to exist. In fact, very few respondents held correct conceptions about five aspects of Common Core standards. Our data also confirm that views toward the standards are tepid—very close to the middle of the scale on a 5-point oppose-to-support scale.
However, our results suggest that the simple refutation text we created substantially reduces people’s misconceptions about Common Core and increases their correct conceptions. Even a week later, there are large differences between those who read the refutation text and those who read a control text in their conceptions and misconceptions about the standards. Furthermore, the refutation text reduced to zero the partisan effect on support for the standards. Finally, the text improved people’s attitudes toward the standards.
Our work suggests several conclusions that are directly relevant to policy. First, we conclude that people’s views about education policy are quite malleable. We saw substantial changes in misconceptions and in attitudes toward Common Core in our study. Second, refutation texts can affect people’s conceptions and attitudes toward policies, even somewhat controversial policies like Common Core. Third, carefully refuting misconceptions can reduce partisan views toward controversial policies. Fourth, with regard to Common Core in particular, there remains a substantial proportion of the populace with misconceptions about the standards that are likely undermining support. Our work points to one approach to solving this problem.
Of course, we cannot know whether refutation texts will work for all education policies. But for controversial policies where misconceptions likely run high, researchers and policymakers should consider testing refutation texts as a means to reduce misconceptions and possibly improve support.
Policymakers often create policies without attending to sustained support. This is not surprising—the political realities are such that passing a law (“doing something”) may matter more for politicians than implementing it carefully over time to ensure sustained support. Of course, laws are not self-implementing, and public support for policies matters. Thus, policies that may be initially popular can become unpopular over time; without a constituency, they can be repealed or undermined during implementation.
A prime example of this is the Common Core State Standards (CCSS). After being rapidly adopted by 45+ states in 2010, the standards appeared to be broadly popular. However, public opinion polls showed that the standards became less popular over time. [1] Well-publicized examples of “Common Core math problems” went viral on social media. The standards became increasingly politicized, with attacks from both the right (largely on federalism or anti-Obama grounds) and on the left (largely on anti-testing grounds) driving up opposition. A recent analysis confirmed that opposition to the standards had risen and that certain key beliefs and misconceptions were strongly associated with opposition to the standards. [2] For example, the belief that Common Core was initiated by President Obama and the belief that states were not allowed to add content to the standards were identified as misconceptions, and some of these were associated with respondents’ opposition to the standards. Furthermore, opposition to President Obama was strongly associated with both the number of misconceptions and with opposition to the standards.
Despite largely falling off the political radar (neither President Trump nor Secretary DeVos has talked much about Common Core in the last year except to say that it is dead), [3] the standards are still an important topic. More than 40 states are still implementing the standards or a very close variant thereof. [4] Billions are still being spent on curriculum materials and professional development.
Given that the standards will likely continue to be implemented for at least several more years in most states, we wondered if we could develop an intervention targeted at dispelling common misconceptions about the standards in order to ensure that public opinion regarding the policy is at least based on facts. We also wondered whether we could overcome the political opposition to the standards by reducing the “Obama effect” uncovered in previous research.
This brief reports the results of a test of an intervention strategy known as a “refutation text;” these have been extensively used to change people’s common misconceptions about science. Our goal was to examine whether this approach could be applied to a policy problem: misconceptions about the CCSS. We answer three questions:
1. What is the impact of the refutation text on correct conceptions and misconceptions?
2. To what extent does the refutation text reduce the relationship of political views (support for President Obama) with correct conceptions and misconceptions?
3. To what extent do these effects persist over a week?
What is a refutation text?
Refutation texts are targeted prose that range in length and type but are written for the purpose of changing widely held misconceptions. Refutation texts have three major components. First, they call attention to a specific misconception, e.g., “Some people think that the earth is flat.” Second, they directly “refute” that misconception, e.g., “However, scientists have shown that the earth is in fact round.” Finally, they support the refutation with evidence, e.g., “The shadow the earth casts on a moon during an eclipse, for example, provides evidence that the earth is actually round.” A refutation text can address one or multiple misconceptions in the same text, so long as this general structure is observed for each misconception.
Refutation texts were first introduced to overcome misconceptions about science, and they have been used extensively and effectively to do so. [5] Refutation texts have been used to address misconceptions in controversial science topics and non-controversial science topics, e.g., seasonal change. [6] However, refutation texts have not been used, as far as we are aware, to shift misconceptions about educational policies, despite being well suited to address such topics. This is a fruitful area to explore, because refutation texts are relatively easy to construct and thus can be used in online content such as blogs or web-based content news sources.
Our refutation text was 300 words, written to address common misconceptions about the CCSS and using the three-part structure previously described for each misconception. It did not have any headings or section headers. Our control text was a version of an Education Week article: “The Common Core Explained. [7] This article was chosen because it also addressed many common CCSS misconceptions and was written for a lay audience but it did not explicitly use our refutation text format. The original article was 1,400 words, and we edited it down to 359 words by removing information that did not address the CCSS misconceptions. [8] Unlike our refutation text, it did have organizing language in the form of section headers that posed questions, e.g., “Who organized the initiative? Who wrote the common-core standards?” Pitting our refutation text against comparable text that is “out in the wild,” as it were, enables us to test the impact of our approach against a more common way of reporting education policies. Both texts are available in the appendix.
Analyzing the impact of our refutation text
In order to test the impact of our refutation text, we recruited 600 respondents from Amazon Mechanical Turk (MTurk). MTurk is a service offered by Amazon that has been used to connect researchers to research respondents in an online marketplace, though this is not its sole purpose. Individuals who agree to participate receive a nominal fee for their time. [9] Recent research in Educational Researcher suggests that MTurk can be a useful tool for educational research because it enables the researcher to obtain “large and more diverse” samples. [10] MTurk was a particularly appropriate venue for this research as we sought to assess the general population’s view of the CCSS and did not want to use a convenience sample of university students. Our respondents are demographically similar to the U.S. population, though we note that they are not representative in the statistical sense. [11] Approximately thirty percent of the original respondents did not complete the one-week follow-up study, but our analysis indicates that they were statistically similar to the original 600 participants. [12]
Questions we asked
We measured the following common misconceptions about the public’s understanding of how the CCSS were implemented by asking respondents to mark the following statements as “true,” “false,” or “unsure”:
1. The Common Core State Standards only apply to English and mathematics.
This is true, but in our 2015 poll we found that only 21% of respondents correctly identified it as such (32% said it was false).
2. Common Core requires more testing than previous standards.
This is false, which 17% of respondents correctly identified in 2015 (37% said it was true).
3. The federal government required states to adopt the Common Core.
This is false, which 22% of respondents correctly identified in 2015 (28% said it was true). Of course, the federal government clearly encouraged states to adopt the standards through its No Child Left Behind waiver program, but it did not require adoption (which is obvious insofar as several states did not adopt the standards).
4. The Common Core State Standards were developed by the Obama administration.
This is false, which 29% of respondents correctly identified in 2015 (18% said it was true).
5. States adopting the Common Core are allowed to add content to the standards.
This is true, which 28% of respondents correctly identified in 2015 (19% said it was false).
These are a subset of the same misconceptions we tested on the 2015 PACE/USC Rossier poll of Californians. [13]
In addition to asking respondents to provide their conceptions with respect to the above five items, we also asked global support/opposition questions that we drew from the 2015 PACE/USC Rossier poll. Specifically, we asked “To what extent do you approve or disapprove of the Common Core State Standards?” on a scale of strongly approve, somewhat approve, neither approve nor disapprove, somewhat disapprove, strongly disapprove. We use this as an outcome to determine whether the refutation text affected support for the standards in addition to affecting conceptions/misconceptions.
Finally, we asked demographic questions, including gender, highest level of education, whether the respondent has school-aged children, employment status, income level, race/ethnicity, and a series of political support variables. We use some of these as covariates and also to answer our second research question.
Comparing our refutation text to the control text
Respondents completed a series of introductory questions about the Common Core, including their sources of information about the standards, their conceptions, and their overall support for the standards. Then, we randomly assigned half them to receive the refutation text and half received the control text. After viewing the text, respondents received the same conceptions questions and support questions again, followed by demographics. One week after completing the survey, respondents received a link to complete a short follow up containing the same conceptions and support questions.
Because respondents were randomly assigned to receive the refutation text or the control, we use straightforward analyses including descriptive statistics, t-tests, and ordinary least squares regressions. [14]
Does the refutation text affect conceptions, misconceptions, and support for the standards?
Before the intervention, we generally find that respondents are neutral toward Common Core and hold a number of misconceptions about the standards. In terms of support, respondents in both treatment and control averaged between 2.8 and 2.9 on a 1-to-5 oppose-to-support scale, indicating just barely opposing the standards on average. Differences between treatment and control were not statistically significant.
Table 1 shows the conceptions and misconceptions by treatment group at pre-test, post-test, and one-week follow up. At pre-test, we find respondents lacked knowledge and had a number of misconceptions about the standards. The item with the most correct conceptions was that 32% of respondents correctly responded that the CCS were not created by the Obama administration. The item with the fewest correct conceptions was that just 16% of respondents correctly identified that the CCS do not require more testing than previous standards. In total, respondents averaged about 1.74 misconceptions and 1.35 correct conceptions at pretest. As expected given randomization, the two groups did not significantly differ on any of the five conceptions or the total number of misconceptions or correct conceptions at pre-test.
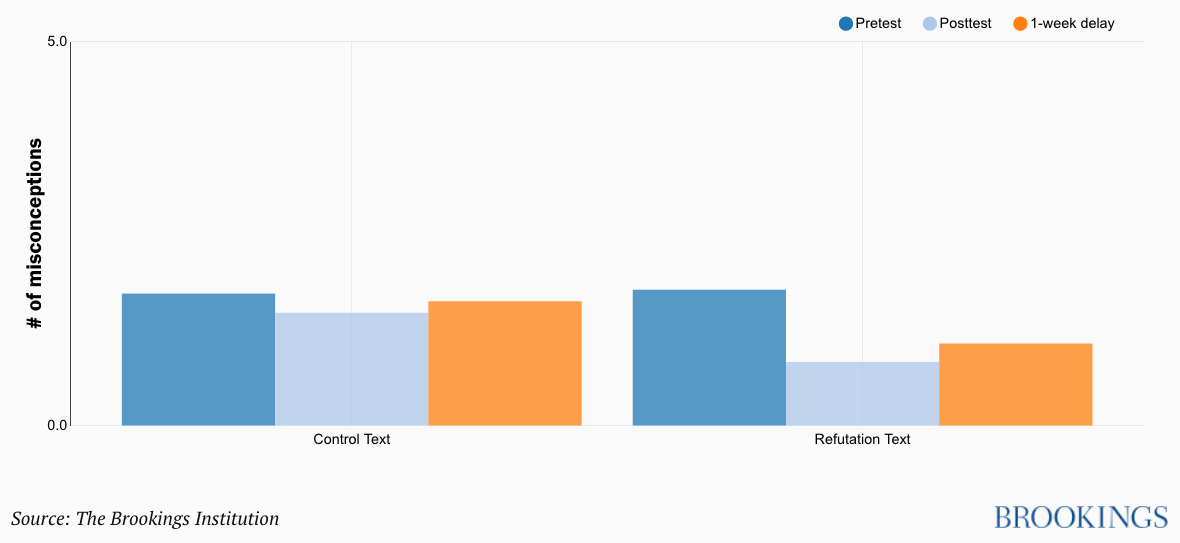
Columns 2 and 5 of Table 1 show that the treatment significantly reduced misconceptions and increased correct conceptions in the refutation text group relative to the control group. Figures 1 and 2 illustrate the effects. As is seen in Figure 1, the number of correct conceptions about the standards increased in both groups, but the increase was much larger in the refutation text group (more than doubling from 1.5 to almost 4 correct conceptions). Similarly, Figure 2 shows that the number of misconceptions decreased by about 1 in the refutation text group but hardly changed in the control text group. Statistical analysis confirms that these differences are all statistically significant favoring the refutation text group. We attribute the improvements in correct conceptions in the control group to the quality and clarity of the control text writing, which also addressed several of the misconceptions but without the refutation text structure.
Item-by-item analyses in Table 1 also show that the refutation text outperformed the control text on four of the six items. In short, the refutation text worked—it reduced misconceptions and increased correct conceptions. It also improved overall attitudes toward the standards—the mean support for the standards at posttest was 3.48 for the refutation text group on the 1-5 oppose-to-support scale, significantly higher than at pretest and higher (though not significantly, mean = 3.30, p = .06) than the control at posttest.
| Table 1. Percentage of respondents with either correct conceptions or misconceptions | ||||||
|---|---|---|---|---|---|---|
| Correct Conceptions | ||||||
| Control | Treatment | |||||
| Pre | Post | Delay | Pre | Post | Delay | |
| The Common Core State Standards only apply to English and mathematics. (True) | 30.0% | 69.0% | 62.7% | 31.3% | 70.0% | 60.4% |
| Common Core requires more testing than previous standards. (False) | 16.2% | 32.3% | 22.5% | 16.3% | 75.6% | 59.9% |
| The federal government required states to adopt the Common Core. (False) | 20.9% | 56.9% | 52.5% | 25.4% | 57.7% | 54.8% |
| The Common Core State Standards were developed by the Obama administration. (False) | 32.0% | 48.5% | 46.1% | 37.1% | 84.0% | 76.0% |
| States adopting the Common Core are allowed to add content to the standards. (True) | 27.6% | 54.9% | 53.4% | 35.2% | 83.4% | 78.8% |
| Average number of Correct Conceptions | 1.27 | 2.62 | 2.37 | 1.44 | 3.72 | 3.30 |
| Misconceptions | ||||||
| Control | Treatment | |||||
| Pre | Post | Delay | Pre | Post | Delay | |
| The Common Core State Standards only apply to English and mathematics. (True) | 33.0% | 20.5% | 23.0% | 32.2% | 22.1% | 29.5% |
| Common Core requires more testing than previous standards. (False) | 48.5% | 45.1% | 56.9% | 53.1% | 16.9% | 22.1% |
| The federal government required states to adopt the Common Core. (False) | 43.4% | 29.6% | 28.9% | 42.7% | 26.1% | 30.9% |
| The Common Core State Standards were developed by the Obama administration. (False) | 24.9% | 31.6% | 32.8% | 28.7% | 10.7% | 14.7% |
| States adopting the Common Core are allowed to add content to the standards. (True) | 21.9% | 19.9% | 20.1% | 20.2% | 9.4% | 9.7% |
| Average number of Misconceptions | 1.72 | 1.47 | 1.62 | 1.77 | 0.83 | 1.07 |
Figure 1. Treatment effects on correct conceptions
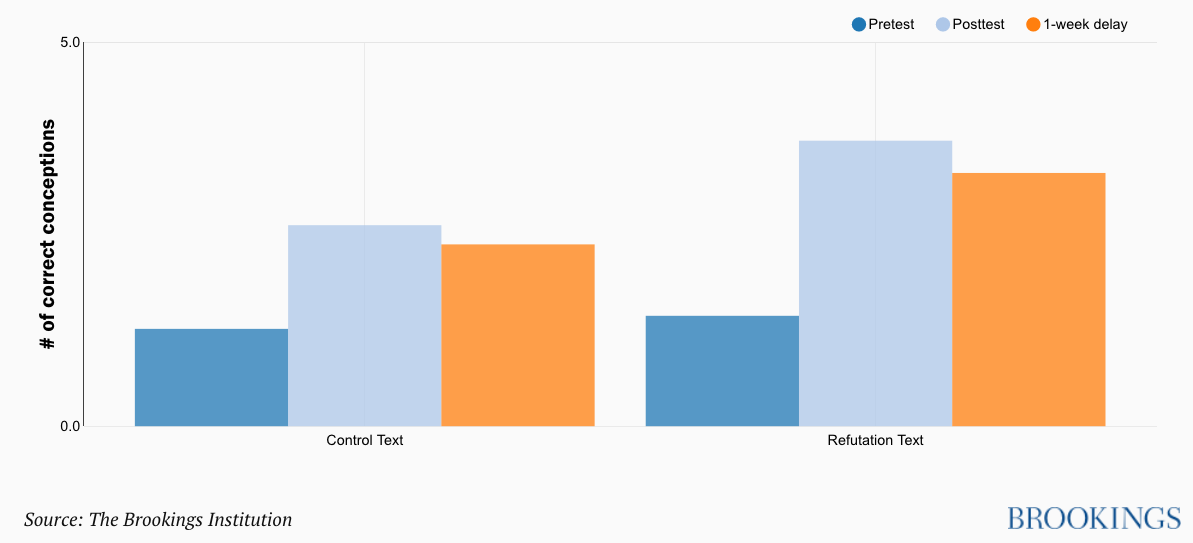
Figure 2. Treatment effects on misconceptions
Does the refutation text reduce the effect of partisan views on misconceptions and correct conceptions?
One of the strongest findings of the earlier work was that respondents’ views toward President Obama were strongly predictive of their misconceptions (and also of their opposition to the standards). We confirm here at baseline that that remains true. Specifically, when we examine misconceptions at baseline, we find that a one-point increase in opposition to President Obama (on a seven-point scale) is associated with a 0.07 point increase in the number of misconceptions (suggesting that the difference between those who maximally oppose President Obama and those maximally support him would be about .44 points—a bit over a quarter of a standard deviation).
The treatment, however, completely erases this “misconceptions gap” between those who oppose President Obama and those who support him. On the posttest, there is no significant difference in misconceptions associated with opposition to the President. In short, the refutation text seems to erase the partisan difference in misconceptions.
Do these effects persist for a week?
While it is promising that the refutation text has an immediate effect on individuals’ conceptions and misconceptions about the standards, it is important to see if the effects are ephemeral. By testing the same respondents one week later (without reintroducing the refutation text) we can see whether the text has any enduring effect.
As seen in Figures 1 and 2 and Table 1, the answer is yes. One week after the treatment, respondents in the refutation text group have more correct conceptions than the control group, and the effect is almost the same magnitude as immediately after treatment (though both groups do decline somewhat in their correct conceptions during the week, which is typically seen in refutation text research). Similarly, the number of misconceptions in the treatment group is lower than in the control group, and this, too, remains statistically significant. In short, our brief refutation text had meaningful effects on respondents’ conceptions and misconceptions about the standards, and these effects persisted for at least a week. Whether the effects would persist beyond that is an important question that merits further study.
Recommendations for policy and research
Refutation texts have been used successfully to refute misconceptions about science topics for decades. This work demonstrates the first application we know of where a refutation text was used to address misconceptions about an education policy. We were able to substantially affect respondents’ conceptions and support toward Common Core with a short, easy-to-read text. Our results were sufficiently powerful to persist even after a one-week delay.
Previous research has shown that misconceptions about a controversial topic, such as genetically modified foods (GMFs), are linked to negative attitudes. [15] These attitudes then inform individuals’ views about policies and laws such as requiring labeling of GMFs. Therefore, when individuals’ views about a public policy are informed by misconceptions it is likely those views are more negative and more resistant to the policy than they would otherwise be. However, when misconceptions are overcome, attitudes tend to shift towards a more positive valence. [16] It follows then that reducing policy misconceptions may increase acceptance of (and perhaps even adherence to) a policy.
We recommend to policymakers who are frustrated by negative views of a policy to ascertain whether there are widely-held misconceptions about the policy. Identifying and then correcting those misconceptions, through the use of the refutation text technique used here, or other strategies, can be an important first step for increasing public support for the policy and perhaps even individuals’ compliance with policy regulations.
While important work still needs to be done to examine the effectiveness of this particular technique for reducing policy misconceptions, we believe the policymakers could benefit from this research to assure that individuals’ acceptance or resistance to a policy is based on accurate conceptions and not “fake news.”
appendix
Refutation text
“Common Core” is the name of the standards for teaching literacy and math in K-12 schools. Some believe that states adopting the Common Core were not allowed to add content to the standards. However, education policy experts have shown this to not be the case. States such as Colorado were allowed to modify standards and add up to 15% of content to them. In fact, 24 of the 44 Common Core states modified or added content in English language arts. States are continuing to modify the standards over time through regularly scheduled revisions.
Many people also think that Common Core requires students to take more tests than previous state standards. However, this is not true—under Common Core, students have to be tested in math and English in grades 3-8 and once in high school, and this is exactly how much testing was required under previous standards.
Some people also think that the Obama administration was responsible for Common Core’s creation. However, expert analysis of the history of Common Core shows this to be incorrect. In fact, the standards were developed by state education leaders. The creation of the standards began in 2009 and was led by the National Governors Association, and 48 of the nation’s 50 governors initially signed onto the standards. Teachers and experts in mathematics and English language arts wrote the standards, and 45 states then adopted them. Neither the Obama administration nor anyone in the federal government wrote the standards, so it is incorrect to say otherwise.
Control text
Brewing since 2007 and launched officially in 2009, the drive for common learning goals in English/language arts and mathematics produced an extraordinary response: All but four states embraced the standards in a huge wave of adoptions in 2010 and 2011. But there was also an extraordinary backlash: By 2015, several states reversed their adoptions of the standards, and nearly half backed out of their initial promises to use tests designed to measure mastery of them.
What are the common-core standards?
Pure and simple, they are descriptions of the skills students should have at each grade level in English/language arts and math by the time they finish high school. They’re not a detailed, day-to-day curriculum; they’re a broad outline of learning expectations from which teachers or district leaders craft a curriculum.
Who organized the initiative? Who wrote the common-core standards?
Governors and chief state school officers launched the official push for the standards. They assembled “work groups” that included university professors, leaders of education advocacy groups, experts from testing companies, and K-12 teachers.
In 2010, the U.S. Department of Education awarded $360 million to two groups of states to design assessments for the common standards. In November 2010, 45 states and the District of Columbia had all agreed to use PARCC or Smarter Balanced, offering the possibility of comparing student performance across many states.
Did we end up with higher, shared standards across the states and a way to compare student performance from state to state?
Not really. All but seven states still had the common standards on their books as the 2015-16 school year began. Whether they are truly more rigorous than every state’s previous standards remains a matter of debate, and many districts were slow to implement the standards, hobbled by a lack of money and good instructional resources. But anecdotal reports suggest many teachers are using the standards to deepen their instruction. As for common tests, this goal fell far short of its original vision. By May 2014, barely half the states still planned to use one of the federally-funded tests when the tests debuted in 2015. The rest designed their own tests or bought off-the-shelf exams.
— Morgan S. Polikoff, Gale Sinatra and Stephen Aguilar
 Dr. Morgan Polikoff is an Associate Professor at the Rossier School of Education at USC. Dr. Gale Sinatra is a Professor of Psychology and Education at Rossier. Dr. Stephen AguiIar is a Provost Postdoctoral Scholar at Rossier. This research was supported by an internal research grant from the USC Rossier School of Education.
This post originally appeared as part of Evidence Speaks, a weekly series of reports and notes by a standing panel of researchers under the editorship of Russ Whitehurst.
The author(s) were not paid by any entity outside of Brookings to write this particular article and did not receive financial support from or serve in a leadership position with any entity whose political or financial interests could be affected by this article.
Notes:
1. See for instance West, M. R., Henderson, M. B., Peterson, P. E., & Barrows, S. (2018). The 2017 EdNext poll on school reform. Education Next, 18(1).
2. Polikoff, M. S., Hardaway, T., Marsh, J., & Plank, D. (2016). Who is opposed to Common Core and why? Educational Researcher, 45(4), 263-266.
3. Klein, R. [Rklein90]. (2018, January 16). .@BetsyDeVosED says COMMON CORE IS DEAD at the federal u.s. department of education at @AEI event [Tweet]. Retrieved from https://twitter.com/rklein90/status/953340933336117252.
4. Korn, S., Gamboa, M., & Polikoff, M. (2016, November 3). Just how common are the standards in Common Core states? C-SAIL Blog. Retrieved from https://www.c-sail.org/resources/blog/just-how-common-are-standards-common-core-states.
5. Sinatra, G. M., & Broughton, S. (2011). Bridging reading comprehension and conceptual change in science education: The promise of refutation text. Reading Research Quarterly, 46(4), 374–93.
6. Danielson, R. W., & Sinatra, G. M. (2016). A relational reasoning approach to text-graphic processing. Educational Psychology Review, 29(1), 1–18.
7. https://www.edweek.org/ew/issues/common-core-state-standards/index.html
8. Readability analyses suggest the readability of the two texts was similar and that a 10th grader should have been able to read and understand the texts.
9. We paid respondents $0.50 the initial survey and another $0.50 for the follow up survey after a 1-week delay (though seemingly low, these are typical to higher-than-average compensation rates for MTurk studies).
10. Follmer, D. J., Sperling, R. A., & Suen, H. K. The role of MTurk in education research: Advantages, issues, and future directions. Educational Researcher, 46(6), 329–34.
11. The sample was 53% female; 79% White, 8% Hispanic, 8% Black, and 7% Asian; thus, it was more white and slightly more female than the general U.S. population. The mean age of respondents was 39 years old (SD = 12.5), quite similar to the national average of 38 years.
12. There was a 30% attrition rate (n = 180) for the 1-week follow up. The response rate to the follow up did not significantly differ between the refutation text group and the control group (71% vs. 69%, p >.70). Furthermore, the demographics of our 1-week follow up respondents are similar to the overall sample—for example, 56% female vs. 53%, 6% Hispanic vs. 8%, and 7% black vs. 8%. Of course, it may be the case that non-responders to our follow up differ in some unobservable way from responders, but our high response rate and the lack of differential nonresponse gives us some confidence that the results we observe would generalize.
13. See Polikoff et al., 2016.
14. Results are always substantively the same whether we use linear or logistic regressions, so we discuss results from the former because they are somewhat easier to interpret.
15. Heddy, B. C., Danielson, R. W., Sinatra, G. M., & Graham, J. (2017). Modifying knowledge, emotions, and attitudes about genetically modified foods. Journal of Experimental Education, 85(3), 513-553.
16. Heddy et al., 2017; Broughton, S. H., Sinatra, G. M., & Nussbaum, E. M. (2013). “Pluto has been a planet my whole life!” Emotions, attitudes, and conceptual change in elementary students learning about Pluto’s reclassification, Research in Science Education, 43(2), 1-22.