Improving Student Achievement: What NAEP State Test Scores Tell Us
by David W. Grissmer, Ann Flanagan, Jennifer Kawata, and Stephanie Williamson
RAND Corporation, 2000.
In the summer of 2000, perfectly timed to shape the election debate over education reform, came a new RAND study that claimed to contradict the conventional research wisdom on the connection between school expenditures and class size on the one hand and student achievement on the other. “Our results certainly challenge the traditional view of public education as ‘unreformable,’” the study’s director, David Grissmer, said in an accompanying press release. “But the achievement of disadvantaged students is still substantially affected by inadequate resources. Stronger federal compensatory programs are required to address this inequity.” While academic studies usually retire to footnote-land, a well-orchestrated PR blitz pushed the RAND report to the front pages. It even earned prominent campaign mentions: Both presidential candidates commandeered the study’s findings to their own ends—Al Gore to support his proposal to lower class sizes, George W. Bush to trumpet Texas’s accountability system.
A trusted name like RAND lent instant credibility to the study’s results—so much credibility that the major newspapers reported the findings without even a question mark. This, combined with the lack of statistical expertise among journalists and the crushing deadlines under which they work, allowed RAND to sculpt the dissemination of its results with a carefully worded press release that pumped its most provocative yet methodologically flawed conclusions. “The education reforms of the 1980s and 1990s seem to be working,” the release began. It went on to highlight the report’s finding that “[d]ifferences in state scores for students with similar families can be explained, in part, by per-pupil expenditures and how these funds are allocated.” In particular, RAND reported that, other things being equal, National Assessment of Educational Progress (NAEP) scores in math are higher in states that have:
- higher per-pupil expenditures
- lower pupil-teacher ratios in the early grades
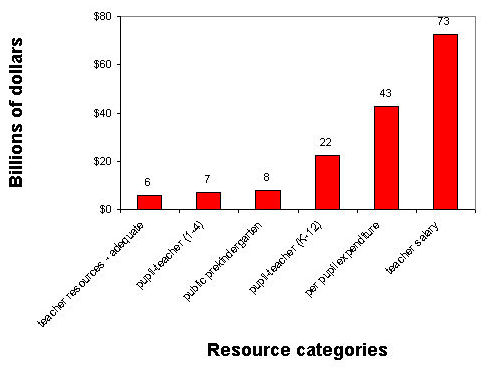
- higher percentages of teachers reporting that they have adequate resources
- more children in public prekindergarten programs
- lower teacher turnover
These highlights were asserted without qualification or doubt, without any mention of weaknesses in the data or the analysis. RAND was notably less charitable with results that accorded with past research findings. The press release at least mentioned the study’s finding that “having a higher percentage of teachers with master’s degrees and extensive teaching experience appears to have comparatively little effect on student achievement across states. Higher salaries also showed little effect.” But here the authors were sure to qualify their findings, carefully emphasizing that “salary differences may have more important achievement effects within states than between states.” The authors quickly rushed past these less popular findings to boldly propose specific policy interventions: “To raise achievement scores, the most efficient and effective use of education dollars is to target states with higher proportions of minority and disadvantaged students with funding for lower pupil-teacher ratios, more widespread prekindergarten efforts, and more adequate teaching resources.” In short, any reader of the news release—or the articles it generated—might have reasonably concluded that RAND, the highly respected think tank, had overturned years of research (including this author’s).
What research does the RAND study purport to contradict? Between 1960 and 1995, per-pupil spending in the United States (in constant 1996–97 dollars) grew dramatically, from $2,122 to $6,434, a threefold increase. This trend cannot be explained by the country’s increased commitment to disabled students, which at most accounts for just 20 percent of the increase. At the same time that costs were rising, the student-to-teacher ratio fell by about a third, from 26:1 to 17:1. Nevertheless, despite our greatly enhanced commitments to public education—and despite the fact that children are growing up in better-educated and smaller families than ever before—student performance during this period, as measured by NAEP test scores for high school seniors in math and reading, moved hardly a hair’s breadth. Complementing these overall trends are more than 400 studies that have searched for a connection between spending and achievement in particular schools, districts, and, occasionally, states. In general, these studies have been unable to detect any consistent, positive relationship between increased resources and student learning.
This is not to say that schools don’t matter. The best of these studies, so-called value-added studies that concentrate on the determinants of growth in achievement across individual classrooms, find that differences in teacher quality have a profound impact. But they also find that teacher quality is not closely related to school resources. The only studies that consistently find positive effects of resources are those that rely on student performance and school data averaged across all students and schools in a state.These aggregate studies, of which the RAND study is one, rely on limited data and are prone to serious statistical shortcomings, so they have been heavily discounted in the past. Undaunted, RAND’s researchers argue that their results should lead to a reinterpretation of three decades’ research.
| The major newspapers reported RAND’s findings without even a question mark. |
However much they might protest, RAND’s researchers for the most part have only confirmed what has been known all along. In fact, the RAND study is startling in its conformity to conventional wisdom. RAND’s best model for estimating the impact of spending increases on student performance yields an estimate that an additional $1,000 per student—a $50 billion annual increase nationally—would yield a rise in performance of about two percentile points (just 0.05 standard deviations), a trivial impact (see Figure 1). Moreover, the RAND study repeats the finding that teachers’ salaries, experience, and whether or not they hold a master’s degree bear little or no relationship to student performance.
| High Costs, Low Returns (Figure 1)
Though RAND said resources were inadequate, it actually found that huge increases in spending would raise test scores by only a trivial amount. National cost of obtaining a 2 percentile increase in NAEP performance using RAND cost estimates* |
 |
| *The hardcopy of Education Matters erroneously refers to Normal Curve Equivalents (NCE) instead of percentiles in the text and presents cost estimates for changing NCE scores by two points in Figure 1. NCEs are a transformed version of percentile scores that follow a normal distribution with a mean of 50 and a standard deviation of 20.
|
What about the study’s most celebrated finding, on the impact of class size? The study found that class size, as measured by a state’s average pupil-to-teacher ratio, has a minuscule impact on the performance of the average student. At best, the RAND study is just another in a long list of reports that have demonstrated the minimal impact of school resources on the typical student’s performance. RAND attempts to distance itself from the conventional research wisdom by declaring that “money, if spent appropriately, is productive.” But who would be surprised by such a tautology? Only if we are told exactly which expenditures are productive can the study give much guidance. But the RAND study’s data are too weak and its methodology too flawed to support the specific policy recommendations its authors make.
A Sow’s Ear
Be skeptical when a research analyst tells you he has fashioned a silk purse out of the proverbial sow’s ear. Consider the limitations of the data with which RAND was working. The study’s sample consisted of 44 independent observations—the states that voluntarily participated in one or more of seven NAEP tests that were administered from 1990 to 1996. Moreover, the number of states participating in any one test varied from 35 to 44. Tests were given in 8th grade math in 1990, 1992, and 1996; in 4th grade math in 1992 and 1996; and in 4th grade reading in 1992 and 1994. Although RAND attempted a variety of analytical methods, its general approach was to estimate the impact of family background and measures of school resources on average student performance on as many of these tests as were administered in a given state.
The NAEP tests themselves have certain advantages.They have been carefully designed, the same test is given in all states, and they allow for comparisons from one time period to the next. Schools have few incentives to score high on the NAEP, leaving little chance that much “cheating” or “teaching to the test” goes on. It is troublesome that, when asked, a sizable number of schools exercise their right to refuse to participate in NAEP testing. Despite this drawback, though, the NAEP remains one of the best available measures of average student performance in most states.
But RAND’s analysis of the NAEP scores is another matter. First of all, 44 observations is a very small sample, so drawing any strong, statistically valid conclusions is at best difficult, at worst misleading. Moreover, data collected at the state level are marvelously imprecise. These aggregate data ignore the enormous differences within a state—implicitly assuming that the past three decades of legal challenges to the inequitable distribution of resources among well-to-do and poor school districts are groundless. When all these differences are averaged away so that it is impossible to identify their importance, how can we possibly have high quality data that trump all previous research on the subject?
While the measure of student performance with which RAND was working was adequate, not much else was. RAND attempted to control for the family background of the students taking the test, but the only information on family background available to RAND was census figures on the average statewide education and income of school-age families in 1990. RAND attempted to adjust these data to the actual years the students took the tests by assuming that these factors change precisely with changes in the racial composition of test-takers. But, of course, one cannot assume that the education and income of students of different racial groups change at the same rate in all 44 states. And RAND did not have any information from individual students; throughout its analysis it refers to average results across the state. So, from the very beginning, RAND was forced to work with an imprecise measure of the characteristics of students who actually took the tests.
Similarly, RAND used statewide averages as its measure of school resources, an extremely imprecise indicator of the actual resources being spent on particular students who attend specific schools. RAND also relied on statewide averages of teachers’ impressions of whether their school supplies were adequate, statewide averages of prekindergarten attendance, and statewide averages of class size. These averages obviously mask wide disparities within a state.
The RAND researchers insist that their study is superior because they factored in the average school resources for all the years that students were in school, a measure they find superior to studies that look only at current resources being spent on a student. This may be a worthy research innovation, though the average school resources available to a student from one year to the next do not change dramatically—unless the student moves, something that happens with surprising frequency. In 1995, 6 percent of the school-age population lived in a different state than they had in 1990; another 2.5 percent had been living outside the United States in 1990. These percentages vary widely among regions of the country. In the mountain states, as many as 15 percent of students had lived elsewhere in 1990. None of this movement was taken into account by the RAND study.
Where Are the Reforms?
These weaknesses in the data were exacerbated once RAND tried to glean specific policy recommendations from its findings. For instance, RAND says that we should reduce class size in states with higher shares of disadvantaged students. RAND, however, doesn’t ever look at whether or not disadvantaged students are in large classes, because they have averaged across all students in the state.
RAND also says that students perform better when teachers think that their supplies are adequate. This finding is plausible. If teachers have adequate materials, one would expect them to be more effective. But it suffers from the chicken-and-egg problem: We can’t be sure whether high-performing students make teachers feel better about their supplies, or whether the supplies themselves have a causal impact. And, of course, this subjective question means wildly different things to teachers in different schools and states.
Much the same can be said for the finding that low teacher mobility leads to higher student performance. Do high levels of teacher mobility lower student performance, or does low performance increase the chances that teachers will move on? One simply cannot tell from the kind of data with which RAND was working.
The authors admit that it would be preferable to have data from the schools that students actually attended. But they claim that using statewide data allows them to consider the fact that the states, not local school boards, are the ultimate political entities responsible for public education within their boundaries. Only by looking at states as a whole can one incorporate the panoply of state policies that may influence school achievement, RAND says. To be sure, statewide analyses can provide accurate estimates of the impact of school resources—but only if the analyst includes within the statistical model all the factors that affect student performance and, in the standard linear regression model generally favored by RAND, if these factors have a constant, additive effect on student achievement. In other words, if the same amount of class size reduction has similar effects on those originally in very large classes and those originally in quite small classes, and if all other factors in the model work in the same constant, additive manner, then relying on state-level data can provide unbiased statistical estimates. But RAND itself argues that the impacts of resources on student performance are anything but constant and additive. Witness its conclusions on class size, where it finds that class-size reduction has its greatest effect in states with high shares of disadvantaged children. Witness also its finding that it is particularly important to reduce class sizes in states that begin with high average pupil-teacher ratios.
| Scholars have been unable to detect any consistent, positive relationship between increased spending and student learning. |
Finally, while the motivation of the entire study was to investigate the role and effect of different state policies, the only policies RAND’s researchers actually built into their main statistical models were differences in per-pupil spending, student-teacher ratios, and other resource variables. Except in an ad hoc fashion, RAND overlooked state efforts to establish accountability in the form of standards and testing and the wide variance in teacher certification requirements. The researchers themselves claim that these policies are important—in fact, they even suggest that such policies explain why Texas students perform better than California’s—yet they didn’t include variations in these policies in the models they constructed, except by creating “fixed effects” models that have so few independent observations that their results can’t survive rigorous statistical tests. In other words, RAND’s analysis failed to include the precise variables that the study itself claims are key.
Overturned?
The RAND study’s authors want to convince people that they have identified the most effective interventions and that outcomes are improving as a result of past reforms. If true, the authors argue, then there is no need to consider more fundamental changes in the education system’s structure or incentives. In order to make this case, the authors must prove that most earlier studies of the impact of school resources on student achievement should be disregarded.
Most scholars believe that studies that look at the impact of resources available to individual schools and specific school districts should be given the heaviest weight because they are the most precise. These studies are also the least likely to find that per-pupil expenditures, teacher pay, or class sizes make a difference.
The studies most likely to find that school resources have a positive effect rely on statewide data, like RAND’s. In this sense, RAND simply repeats an already well-known finding: that if you rely on imprecise statewide data and if you ignore all other aspects of state educational policy, you will often find that average statewide school spending and class size have at least a minor effect on student performance. But as mentioned previously, these studies have a serious methodological limitation: They rely on average results obtained from large, heterogeneous units that differ from one another in many ways other than the amounts they spend on schools.
RAND claims that only by looking at statewide data can you include the impact of statewide policies. Yet statewide studies have not yet found a way of including information about these policies in their statistical analyses. As a result, it is difficult to place more weight on these findings than on those that look at individual schools and school districts.
Again, this is not to say that schools don’t matter. On the contrary, value-added studies find that teacher quality has a major impact on student performance. If we could find ways of keeping good teachers in the classroom—perhaps by giving these successful teachers the additional compensation it would take to encourage them to make teaching a lifelong career—then we could probably boost student performance significantly.
| The RAND study is startling in its conformity to conventional wisdom. A huge, $50 billion annual increase in spending would yield a trivial two-point rise in test scores. |
But the authors of the RAND study take exception to value-added research. They claim that value-added studies that measure gains from one point in time to the next fail to account for the fact that “two students can have pretest scores and similar schooling conditions during a grade and still emerge with different posttest scores influenced by different earlier schooling conditions.” Put simply, Suzie may learn more than Johnny in 3rd grade not because Suzie had the better teacher that year but because she may have had a better education the previous year, even though this was not reflected in her 2nd grade test score. Since value-added studies usually don’t incorporate a student’s entire educational history, their results, according to the RAND study, may be biased in some unknown direction.
RAND, however, doesn’t provide any persuasive evidence that this is the case either in its own study or from other studies. Of course, one cannot rule out the possibility that gains in a particular year may somehow be influenced by events in the past. But RAND’s critique of value-added studies comes back to haunt its own research. If its critique is valid, then RAND’s own results are just as flawed as the results of the studies RAND criticizes. If earlier school conditions are important and affect the impact of current resources on student achievement, then one cannot assume constant, additive effects across all students in the state—the RAND researchers’ own methodology. Instead it is necessary to know the specific paths of resources to the individual students in the state and to incorporate that information into the statistical analysis. In other words, the very arguments the authors use to make the case for the superiority of their estimates over the hundreds of previous estimates again undermine their own analysis.
The RAND researchers also try to bolster their methodology by referring to the Project STAR (Student-Teacher Achievement Ratio) experiment, which involved a substantial reduction in class size (from an average of 24 students to an average of 16 students) in Tennessee. The study has received a great deal of attention, in part because it is one of the few evaluations of school resources based on random assignment of students to test policy effects while controlling for other conditions, a method that is generally thought to be a high-quality research design. However, the findings from the study are often misunderstood and misinterpreted, and RAND’s scholars have only added to the confusion.
In essence, the Tennessee study shows that students in substantially smaller classes in their first year of schooling (whether kindergarten or 1st grade) perform better than those remaining in classes of larger size. No similar benefits were observed for students in older grades, however. Those in the smaller kindergarten classes maintained the same higher achievement level that they had realized in kindergarten.
The STAR study, while methodologically superior to the RAND study, has its own limitations. The principle of random assignment was potentially compromised in several ways, and no student test information was obtained before assigning students to “control” and “experimental” groups. As a result, it is unclear how much the study, as implemented, deviated from a random-assignment design. Since almost all the gains from small-class assignment were registered in the initial year, it is possible that even these small “gains” were apparent rather than real.
| RAND’s interpretation of its results far exceeds the normal bounds of inference, suggesting that the authors had a prior policy commitment. |
But even if the STAR study doesn’t suffer from these implementation flaws—without baseline data we’ll never know one way or another—the study is not open to the inferences made by the RAND researchers. First, RAND assumed that the STAR study demonstrates that class-size reduction is effective in multiple grades when in fact it demonstrates, at most, that a very large reduction in class size has positive effects only in the first year of schooling. After that, the initial effects only manage to survive—they do not continue to increase even when the student remains in much smaller classes. Yet RAND uses these results to justify its policy recommendation to lower class size throughout the elementary school years.
Second, the RAND authors try to validate their own problematic methodology by claiming that their estimates of the effects of class size reduction are essentially the same as those obtained from the STAR study. But assessing the validity of studies by their answers violates all scientific principles. Generally speaking, a study’s validity depends on the scientific merits of its methodology, not the results it obtains. And even if one were to accept RAND’s claim to validity by virtue of its match with the results of another study, this claim applies only to the class-size findings.
Conclusions
RAND’s claims to have overturned conventional research wisdom are highly problematic. The report draws sweeping conclusions from average statewide data for just 44 states. The analysis of these data is subject to significant analytical error. The authors leave out of the statistical equations factors that they themselves insist are of critical importance. Claiming that only state-level analysis can take state policies into account, the researchers then leave key state policies out of their most crucial equations.
Worse, the interpretation of the results far exceeds the normal bounds of inference, thereby suggesting that the authors had a policy commitment that shaped their handling of the material.
But let’s take the RAND study at its word. If we do, we would conclude that, in general, education expenditures have little effect on student performance, that increasing teacher pay yields no effect, that the effects of class-size reduction depend very much on the state in which it is implemented, that monies should be set aside so that teachers who say they need them have more materials. The study also asserts that the strong accountability systems in Texas and North Carolina led to particularly spectacular student achievement gains in the early to mid-1990s. This is not necessarily a bad policy agenda. But one can hardly cite the RAND study as scientific evidence that it is the correct one. The conclusions reached by the RAND authors are based more on their personal sense of plausibility than on results from high-quality data subject to properly specified statistical equations.
–Eric A. Hanushek is a senior fellow at the Hoover Institution at Stanford University and a research associate of the National Bureau of Economic Research.