Evaluations of school-reform measures typically focus on the outcomes that are most easily quantified, namely, test scores, as a proxy for long-term societal benefit. But there are at least two reasons we might want to look beyond test scores and other school-based outcome measures. First, there is evidence that schools facing accountability pressures may be able to raise student test scores through methods that do not translate into long-term improvements in skills or educational attainment, by engaging in test-prep activities or by cheating, for example. Second, even in the absence of such behaviors, the correlation between test-score gains and improvements in long-term outcomes has not been conclusively established. Studies of early-childhood and school-age interventions often find long-term impacts on such outcomes as educational attainment, earnings, and criminal activity despite nonexistence or “fade-out” of test-score gains. In other words, programs can yield long-term benefits without raising test scores, and test-score gains are no guarantee that impacts will persist over time.
In this study, I investigate whether the opportunity to attend a school other than a student’s assigned neighborhood school reduces criminal activity, especially among disadvantaged youth. Many of the schools chosen by the students were “better” on traditional indicators, such as student test scores and teacher characteristics. All of them, however, were preferred by the applicant over the default option. The analysis therefore sheds light on whether efforts to expand school choice can be an effective crime-prevention strategy, particularly when disadvantaged students can gain access to “better” schools.
We know that criminal offenders often have low levels of education: only 35 percent of inmates in U.S. correctional facilities have earned a high school diploma, compared to 82 percent of the general population. Criminal activity is concentrated among minority males; it begins in early adolescence and peaks when most youth should still be enrolled in secondary school. The schools these young men would attend are typically in high-poverty urban neighborhoods, have high rates of violence and school dropout, and struggle to retain effective teachers. Such schools may be a particularly fertile environment for the onset of criminal behavior. Yet little research has been conducted to determine the effect of school quality on crime.
In this study I explore this question using data from the Charlotte-Mecklenburg (North Carolina) school district (CMS) to measure the impact of school quality on arrest and incarceration rates. I take advantage of the CMS districtwide open-enrollment school-choice plan, which until recently let students choose where they wanted to go to school and employed lotteries to admit students to oversubscribed schools. I compare the criminal activity of students who won the lottery to attend their first-choice school to that of students who lost the lottery.
I find consistent evidence that attending a better school reduces crime among those age 16 and older, across various schools, and for both middle and high school students. The effect is largest for African American males and youth who are at highest risk for criminal involvement. In general, high-risk male youth commit about 50 percent less crime as a result of winning the school-choice lottery. They are also more likely to remain enrolled in school, and they show modest improvements on measures of behavior such as absences and suspensions. Yet there is no detectable impact on test scores for any youth in the sample.
School Choice in CMS
With more than 150,000 students enrolled in 2008–09, Charlotte-Mecklenburg is the 20th largest school district in the nation. The CMS attendance area encompasses all of Mecklenburg County, including Charlotte and several surrounding cities. Overall, CMS is racially and demographically diverse. About 45 percent of the students in CMS middle and high schools in 2003 were African American, less than 10 percent were Hispanic (although the Hispanic population was growing rapidly over this period), and about 50 percent were eligible for free or reduced-price lunches. Individual CMS schools vary widely in demographic composition: CMS high schools in 2003 ranged from less than 10 percent to close to 90 percent nonwhite, and were also dissimilar in average test scores and rates of high school graduation.
From 1971 until 2001, CMS schools were forcibly desegregated under a court order. Students were bused all around the district to preserve racial balance in schools. After several years of legal challenges, the court order was overturned, and CMS was instructed that it could no longer determine student assignments based on race. In December 2001, the CMS school board instituted a policy of districtwide open enrollment for the 2002–03 school year. School boundaries were redrawn as contiguous neighborhood zones, and children who lived in each zone were guaranteed access to their neighborhood school. Under busing, schools were racially balanced, but the surrounding neighborhoods remained highly segregated. Thus the redrawing of school boundaries led to concentrations of minority students in some schools.
The first open-enrollment lottery took place in the spring of 2002. CMS conducted an extensive outreach campaign to ensure that choice was broad-based, and 95 percent of parents submitted at least one preferred school; parents could submit up to three (not including their neighborhood school). Admission for all students from outside the neighborhood zone was subject to grade-specific limits. The lottery process for oversubscribed grades gave preference first to students who previously attended the school and their siblings, then to low-income students applying to schools that previously did not have a majority of low-income students, and finally to students applying to a school within their “choice zone” (which would guarantee them access to district-provided transportation). I study the effects of winning a seat at a preferred school in the 2002 lotteries on student outcomes through 2009, seven years after the lotteries were conducted.
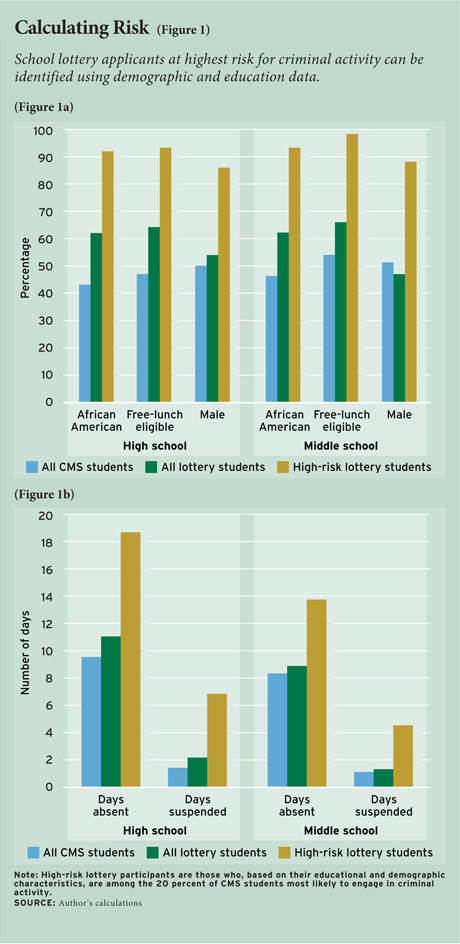
Because nearly all rising 12th graders received their first choice, I restrict my study to students in grades 6 through 11. I also exclude the 5 percent of students who were not enrolled in any CMS school in the previous year. About 60 percent of the remaining students chose (and were automatically admitted to) their neighborhood school. About 75 percent of applicants to nonguaranteed schools were in lottery priority groups in which the probability of admission was either zero or one. Even though these students chose a nonguaranteed school, there is no randomness in whether they were admitted, so I do not use them in the study. The resulting sample consists of 1,891 high-school students (grades 9–11) and 2,320 middle-school students (grades 6–8). Compared to all students in CMS, these students were more likely to be African American and eligible for free lunch; they also had lower test scores and higher rates of absence and out-of-school suspensions (see Figure 1).
 Data
Data
Since the mid-1990s, the North Carolina Department of Public Instruction (NCDPI) has required all districts to submit data that include demographic information, attendance rates, and behavioral outcomes, yearly test scores in math and reading for grades 3 through 8, and subject-specific tests for higher grades. I used these data, along with internal CMS files that contain student-identifying information such as name, date of birth, and exact address in every year. This information enabled me to match CMS students to arrest records from the Mecklenburg County Sheriff’s Office, which include all arrests of adults (age 16 and over in North Carolina) that occurred in the county.
I measure crime severity in two ways, both of which are intended to capture the idea that not all crimes are equal. First, I use estimates that economists have developed of the social cost of crimes, which include tangible costs, such as lost productivity and medical care, as well as intangible costs, such as impact on quality of life; these estimates are extremely high for fatal crimes. (The estimated social cost of murder is $4.3 million in 2009 dollars. The next costliest crime is rape, which is estimated at $125,000.) To avoid the results being driven entirely by a few murders, in my main analysis I limit the cost of murder to twice the cost of rape. The second measure of severity weighs crimes by the expected punishment resulting from a successful conviction. Neither measure accounts for justice system costs such as police or prisons.
Methodology
If the school lottery is truly random, the winners and losers will on average have identical observed and unobserved characteristics. With a large enough sample, a simple comparison of outcomes between winners and losers would identify the causal effect of winning the lottery. In reality, CMS conducted many lotteries (for each school and grade). The number of students in each lottery is relatively small, so my analysis combines data from all of the middle-school and all of the high-school lotteries. My results reflect the average difference in outcomes between winners and losers across all of the lotteries conducted at each level.
The result is the “intent-to-treat” effect of winning a lottery; it is an intent because students offered a place in their first-choice school did not always take it (for example, they may have moved out of the district). Students who won the lottery are more than 55 percentage points more likely than losers to attend their first-choice school in the first year, and on average spend an additional 1 to 1.5 years enrolled in that school overall. One can therefore obtain a rough estimate of the effect of actually attending the first-choice school (as a result of winning the lottery) by doubling the results presented below.
I examine the impact of winning the lottery on crime separately for groups of students with different propensities to commit crimes, with a focus on the highest-risk group. Because students with adult arrest records can be tracked all the way back to kindergarten in some cases, I use all of the potential predictors of criminal behavior—test scores, demographics, behavior, and neighborhood characteristics—to calculate an index of crime risk. The students in the top 20 percent of this crime-risk index are disproportionately African American males and eligible for free lunch (see Figure 1a). Their test scores are on average one standard deviation below the North Carolina state average, and they are absent and suspended many more days than the average student (see Figure 1b). Because high-risk students are overwhelmingly male, I exclude females from all of the analyses. The results comprise a final sample of 1,014 high-school students and 1,081 middle-school students.
High-school lottery winners attend schools that are demographically very similar to the schools attended by lottery losers, while middle-school winners attend schools that are less African American and higher income on average. All lottery winners travel farther to attend their first-choice school, but the distance is greater for high school students than for middle school students.
High-school lottery winners in the high-risk group and all middle-school lottery winners experience modest increases in standard measures of school quality. Their peers’ average test scores are about 0.15 standard deviations higher, and the new schools have higher-quality teachers, measured in terms of the fraction of teachers with less than three years’ experience, the fraction that are new to the school that year, the percentage of teachers with an advanced degree, and the share of teachers who attended a “highly competitive” college as defined by the Barron’s rankings. For youth in the high-risk group, the gain as measured by these quality indicators is roughly equivalent to moving from one of the lowest-ranked schools to one around the district average.

Results
I find that winning a lottery for admission to a preferred school at the high school level reduces the total number of felony arrests and the social cost of crime. Among middle school students, winning a school-choice lottery reduces the social cost of crime and the number of days incarcerated. Importantly, I find that these overall reductions in criminal activity are concentrated among students in the highest-risk group. Indeed, I find little impact either positive or negative of winning a school-choice lottery on criminal activity for the 80 percent of students outside of this group.
Consider first the results for high school students in the high-risk group. Among these students, winning admission to a preferred school reduces the average number of felony arrests over the study period from 0.77 to 0.43, a pattern driven largely by a reduction of 0.23 in the average number of arrests for drug felonies (see Figure 2). The average social cost of the crimes committed by high-risk lottery winners (after adjusting the cost of murders downward) is $3,916 lower than for lottery losers, a decrease of more than 35 percent. (Without adjusting for the cost of murder, I estimate the reduction in the social cost of crimes committed by lottery winners at $14,106.) High-risk lottery winners on average commit crimes with a total expected sentence of 35 months, compared to 59 months among lottery losers.
Among high-risk middle-school students, I find no effect of winning a school-choice lottery on the average number of felony arrests. Although the number arrests for violent felonies falls, this is offset by an increase in the number of property arrests. Because violent crimes carry greater social costs, however, winning a school-choice lottery reduces the average social cost of the crimes committed by middle school students by $7,843, or 63 percent. It also reduces the total expected sentence of crimes committed by each student by 31 months (64 percent).
An important limitation of this analysis is that I do not have access to data on juvenile crime. Especially for students in the middle school sample, this could mask big differences in juvenile offending in the early years after the lotteries were conducted. As an alternative, I examine the effect of winning the lottery on school disciplinary outcomes such as absences and suspensions, as well as on test scores. Among the high-risk group, lottery winners are absent slightly less than the lottery losers are. The effect on high school suspensions in 2003 is relatively large, but the other school discipline effects are small and statistically insignificant.
In contrast to the results for crime and disciplinary outcomes, I find no evidence that winning admission to a preferred school leads to test-score gains. But I do find some impacts on enrollment, grade progression, and grade attainment for high-risk youth. For example, high-risk middle-school lottery winners are 18 percentage points more likely than lottery losers to be enrolled in CMS in their 10th-grade year. The effect on 11th-grade enrollment is about half the size (9 percentage points), and there is no impact on persistence into 12th grade.
Despite the impacts on enrollment and progression, there is no detectable increase in high school graduation rates. Because I am limited to CMS administrative data, it is difficult to distinguish dropouts from subsequent GED recipients or transfers who may have graduated elsewhere. Administrative records are particularly problematic for high-risk youth, who sometimes disappear from CMS well before they are old enough to do so legally. The graduation rate is only about 25 percent among high-risk high-school students, and currently only about 10 percent among high-risk middle-school students, although some who are still enrolled may yet graduate. Additionally, a bit less than 10 percent of the high-risk middle-school sample never appears in any high school grade but subsequently appears in the arrest data. Because any intervention aimed at high school students would miss this group altogether, this suggests that high school might be too late for the youth at highest risk of criminal activity.
Explanations and Policy Implications
Overall, I find that winning the lottery to attend a first-choice school has a large impact on crime for high-risk youth. High-risk lottery winners experienced roughly a 50 percent reduction in the measures of criminal activity that weight crimes by their severity.
I consider four possible explanations for the reduction in crime among high-risk lottery winners. The first is incapacitation, which advances that winning the lottery entails longer bus rides to and from school, thus occupying youth during high-crime hours. The second is contagion, in which winning the lottery prevents crime by removing high-risk youth from crime-prone peers or neighborhoods, thereby reducing contemporaneous exposure of high-risk youth to criminogenic influences. These first two explanations would predict a strong initial effect that fades over time. If, for example, drug-market activity is concentrated within a few schools, we might expect large differences in criminality in the high school years that diminish as enrollment in the chosen school ends and lottery winners and losers return to the same neighborhoods. When I examine the effect of winning a school lottery separately at different points in time after the lotteries were conducted, however, I find larger effects in later years. I therefore conclude that there is little support for the incapacitation and contagion explanations since they do not fit the pattern of results over time.
A third possibility is that the reduction in crime comes from the skills students gain by attending a higher-quality school. If the schools attended by lottery winners do a better of job of teaching skills that increase students’ ability to find employment, they will stay enrolled in school longer, delaying the onset of criminality through the peak period of offending behaviors. Moreover, youth with more and better schooling will gain access to more and better opportunities for paid work, making crime less attractive. Based on a back-of-the-envelope calculation of the relationship between enrollment and criminal activity in my sample, I estimate that the effects of winning a school lottery on enrollment could potentially explain about 45 percent of the impact on criminal activity in the high school sample, but only about 10 percent in the middle school sample.
Alternatively, peer networks formed in middle or high school could have a persistent influence on adult criminality without affecting skills directly. In my own data, I find relatively little evidence that the propensity of a student’s peers to engage in criminal activity influences the degree to which he commits violent crimes. This may be due in part to the high rate of early dropout among violent felons. However, having crime-prone peers in middle school substantially increases the likelihood of committing a violent crime, especially for youth in the high-risk group. Based on this relationship, I estimate that changes in peers can explain roughly 9 percent of the impact on violent arrests in the middle school sample.
Regardless of the mechanisms by which admittance to a preferred school influences criminal activity, the fact that these impacts are concentrated among high-risk students has important implications for the design of school-choice programs. It may make sense for oversubscribed schools of choice to give preferential admission to students at greatest risk of criminal activity. To illustrate this point, I use my results to evaluate the consequences of two different types of lotteries: 1) those giving priority to the highest-risk students and 2) a simple lottery similar to those virtually all charter schools nationwide are required to use to admit students when the schools are oversubscribed. The actual CMS lottery system gave preferences to low-income students who applied to schools with a low fraction of low-income students. As a consequence, many poor (and high-crime risk) students were automatically admitted to schools while other students had to win the lottery.
If slots in oversubscribed schools were systematically allocated to the highest-risk students, the social cost of crime would fall by an additional 27 percent relative to the actual CMS assignment mechanism. A more realistic form of targeting is the method actually pursued by CMS, giving preference to low-income students within the lottery system. I estimate that this policy choice lowered the social cost of crime by about 12 percent, relative to a simple charter-style lottery with no preferential treatment. Although this analysis does not consider the possibility that a greater concentration of high-risk students could have adverse effects on other students, it nonetheless highlights the likely beneficial consequences of giving preference to disadvantaged students in the admissions process for oversubscribed schools.
Conclusion
In this study, I find that winning a lottery for admission to the school of choice greatly reduces criminal activity, and that the greatest reduction occurs among youth at the highest risk for committing crimes. The impacts persist beyond the initial years of school enrollment, seven years after the school-choice lottery was held. The findings suggest that schools may be an opportune setting for the prevention of future crime. Many high-risk youth drop out of school at a young age and are incarcerated for serious crimes prior to the age of high school graduation. For these youth, who are on the margins of society, public schools may present the best opportunity for intervention.
The end of busing and the implementation of open enrollment in CMS was a significant policy change. The four neighborhood high schools to which most of the lottery applicants were assigned lost more than 20 percent of their enrollment in a single year. In subsequent years, two of these schools were restructured as magnet schools offering specialized programs in a small school setting. Two middle schools that lost significant numbers of students were subsequently closed. The open enrollment policy thus sent a strong signal of parental demand to CMS that may have resulted in the shutting down or restructuring of low-performing schools. The No Child Left Behind Act of 2001 included a provision that allowed parents to transfer students from “persistently dangerous” public schools, but many states have set the legal threshold so high that very few schools qualify. The results here suggest that, to the extent that low-quality schools are also persistently dangerous, allowing students to leave them might benefit individual students as well as society as a whole.
David J. Deming is assistant professor of education at the Harvard Graduate School of Education. This article is adapted from a study in the November 2011 issue of the Quarterly Journal of Economics.
This article appeared in the Spring 2012 issue of Education Next. Suggested citation format:
Deming, D.J. (2012). Does School Choice Reduce Crime? Evidence from North Carolina. Education Next, 12(2), 71-76.