
Checked: “Quality Counts,” Education Week, January 6, 2005
“The Funding Gap,” Education Trust, Fall 2004.
Checked by Robert M. Costrell
This is a tale of two rankings. They represent the best of states-and the worst of states. A little wisdom and considerable foolishness. Some light, some darkness. Most of all, they purport to be about the same thing, but are strikingly at odds with each other. And that can be confusing.
Each January since 1997, Education Week, the K-12 industry’s newspaper of record, has issued its “Quality Counts” report, ranking states by, among other things, the “equity” of their school finances. And every fall since 2001, the Education Trust, a national organization devoted to closing the achievement gap in our public schools, has issued “The Funding Gap” report, also ranking states by the equity of their K-12 finance systems. Both lists receive a great deal of attention, as winning states issue press releases claiming credit for high marks, and education interest groups point fingers at those at the bottom. Litigants on both sides of school finance cases submit their preferred rankings as evidence, and judges sometimes cite them in their decisions. In a widely followed New Jersey case, Abbott v. Burke, a 1998 court order (one of a long series of education directives in that case) concluded with numerous citations of Education Week‘s material, including New Jersey’s Report Card, showing the state’s grade of D+ in equity, ranking 47th in the nation.
The rankings by Education Week and Education Trust, however, produce some wildly contradictory results. For instance, despite large court-ordered funding hikes to poor urban districts, the districts that were the focus of Abbott, New Jersey still received a grade of only C in equity (a ranking of 33rd in the nation) from Education Week. By contrast, Education Trust’s report, reflecting the effect of Abbott, ranked the Garden State as the second most equitable school finance system in the country. Other discrepancies are even worse. Education Trust ranks Massachusetts at the very top and New York at the very bottom of its list, while Education Week flips these rankings virtually upside down. How can two well-respected groups reach such different conclusions about the same thing?
Measuring the Funding Gap
Education Week‘s equity rankings depend on measures of the spread between higher- and lower-spending districts. This assumes that the high-spending districts are the rich ones, but that is no longer true in many states.
Specifically, Education Week ranks states on a composite equity index that has three components, the most important of which is the McLoone Index (named after Eugene McLoone, now a retired professor of education finance at the University of Maryland). This index calculates how close low-spending districts are to the state median, by comparing total spending in districts at or below the median with the amount that would be required were they to spend at the median. The ideal ratio, by this measure, is 100 percent, where no district spends below the median. An index of 95 percent means the additional funds required to bring all districts up to the median would be 5 percent of the required total. Another component of Education Week‘s composite index also measures the dispersion of spending among districts; the third component measures the association between a district’s education revenues and its property wealth. These two measures can affect the overall Education Week rankings in specific cases, but they are distinctly less correlated with the composite than is the McLoone.
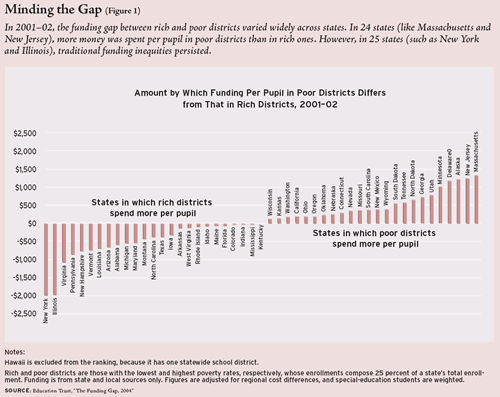
To focus more directly on the gap between rich and poor, the Education Trust began issuing its own equity rankings several years ago, with “The Funding Gap.” Using census data to sort districts within each state by the federal poverty rate among school-age children, the group identified the poorest and richest districts-those with the highest and lowest poverty rates, respectively, whose enrollments compose 25 percent of the state’s total enrollment-and matched that information with education revenues from state and local (but not federal) sources. Adjustments are made for regional cost differences and special-education students (who, it is assumed cost 1.9 times as much to educate as regular students)-the same as in Education Week. The resulting “funding gap” is the difference between per-pupil revenues in poor and rich districts. That gap is positive in states where funding of poor districts exceeds that of rich ones, and it is negative where the reverse is true (see Figure 1). A positive gap is considered equitable and a negative gap is not. Education Trust has a second, closely related measure, which assigns low-income students a weight of 1.4 in the per-pupil calculation, on the assumption that it costs 40 percent more to educate low-income children. This shifts the gap down somewhat, but the rankings themselves are very similar, with a correlation of 0.98. Education Trust also presents rankings on the funding gap between minority and nonminority districts.
Conflicting Rankings
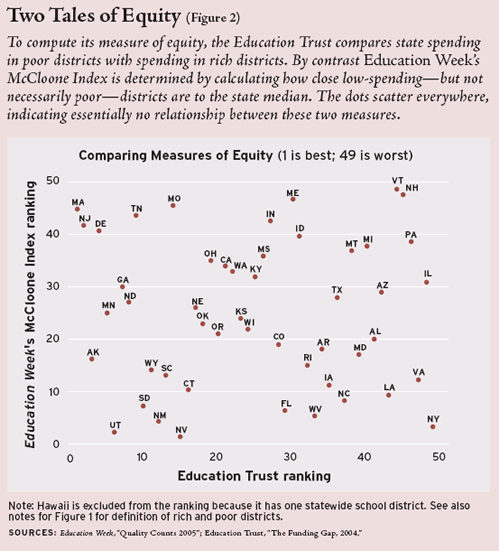
The conflicts between Education Trust and Education Week measurements are most apparent at the extremes (top or bottom), exactly the parts of the lists that gain most public attention. Of the ten states rated tops in equity by Education Trust, five are ranked in the bottom third by Education Week‘s composite index (Massachusetts, New Jersey, Georgia, North Dakota, and Tennessee); among Education Week‘s top ten are four states (Iowa, West Virginia, Louisiana, and New York) that are in Education Trust’s bottom third. The overall relationship between the two measures is very low; it is essentially nil between Education Trust and Education Week‘s McLoone Index (see Figure 2). Can they both be measuring equity?
Given the importance of the equity issue to the education policy debate, this is a question worth exploring. How is it that states ranked at one extreme on the funding gap between poor and rich districts (Education Trust) can be ranked at the opposite extreme on how much it costs to raise all districts to the median (Education Week‘s McLoone Index)?
Part of the answer is in the question: states that spend considerably more on poor districts than rich ones can be ranked very low by Education Week because the McLoone Index is measuring the cost of increasing the spending on rich districts toward that on poor ones.
Consider the two states at the top of Education Trust’s rankings, Massachusetts and New Jersey. Massachusetts’s progressive school-finance system, the product of reforms made in 1993, begins by establishing a minimum per-pupil spending figure-the foundation budget-that accords low-income children a premium of about 42 percent over that allotted other children. (According to “Quality Counts 2005,” 23 state formulas have an adjustment for low income, but most provide no more than a 25 percent premium.) State aid in Massachusetts is targeted at districts that cannot meet the foundation budget out of local funds, so the state’s education dollar is concentrated on poor districts. Rich districts may choose to spend more than their foundation budget out of locally generated funds, but on average they still spend less than poor districts do.
As we saw earlier, the story is similar in New Jersey. The Abbott litigation forced the state to devote large sums of money to spending in poor urban districts, resulting in its high ranking by Education Trust. Even Education Week‘s raw dataset shows that the poorest districts (those with the most students living in poverty) spend, on average, 122 percent of the state’s median. In fact, Education Week highlights the New Jersey case, showing that the Abbott districts have reversed the 1996 gap and now exceed in spending by 13 percent the 30 K-12 districts that were previously the state’s highest spenders.
While this would appear to suggest finance equity, Education Week still ranks New Jersey near the bottom (42nd) on the McLoone Index and Massachusetts even further down (45th). In both New Jersey and Massachusetts, the districts spending below median have less than half the poverty of the rest of the state. Almost none of New Jersey’s and Massachusetts’s poorest districts enter into the McLoone calculation because they spend above the median. Even so, Education Week obliviously opines, “New Jersey has room to improve when it comes to the equitable distribution of education dollars.” Education Week seems to have missed an opportunity to reflect on the measures that form the basis of its report card, since the only way New Jersey and Massachusetts could “improve” equity in Education Week‘s ranking would be to increase funding for relatively affluent districts.
It has long been known that the measures Education Week uses do not distinguish between progressive and regressive disparities in spending. Perhaps in an earlier era, when spending gaps were more consistently regressive, the problem was not overwhelming. Today, however, funding gaps are progressive in as many states as they are regressive. Indeed, in Education Week‘s own dataset, 40 states spend more in the poorest quartile of districts than in the richest. (This is more states than indicated in Figure 1 because these data include federal funds, targeted at poor districts.) Also, in 40 states, the average poverty rate is higher in districts that spend above the median than below it. Thus in today’s environment, for the vast majority of states, Education Week‘s McLoone Index measures equity by the cost of increasing spending in relatively well-off districts. This seems to be exactly the reverse of what most users of Education Week‘s rankings would assume.
Some Other Problems
What about those states at the bottom of Education Trust’s spectrum, the ones that spend considerably less on poor districts than on rich ones? Here, at least, one might think the McLoone Index would generate a ranking similar to Education Trust’s. Pennsylvania, for example, is 39th on McLoone and 46th on Education Trust. But what explains New York, dead last on Education Trust’s rankings and third on Education Week‘s McLoone Index? The answer: New York City, which has 37 percent of the state’s students. New York City dominates the Education Trust calculation: the funding gap is essentially the difference between New York City’s revenues and the revenues of the state’s richest districts (see Figure 1 and “The Legal Cash Machine,” page 26). This gap is not reflected in Education Week‘s McLoone Index because New York City, although among New York state’s poorest districts, is also the state’s median-spending district-and therefore the benchmark for the McLoone Index’s comparisons. In states where the median district is huge, the proportion of the population below the median can be considerably less than 50 percent; for New York, it’s only 18 percent. (This is also true in Illinois, where Chicago is the median-spending district.) Since it costs nothing to increase New York City’s spending to the state median, this accounts for two-thirds of the state’s high McLoone Index. It also strongly suggests the McLoone Index is meaningless for New York. And yet, based on the McLoone, Education Week‘s report card states, “New York does fairly well in its grade for resource equity.”
Another problem that arises in equity rankings concerns the state (as opposed to local) share of education funding. Education Week‘s equity rankings used to depend heavily on the state share, but the measure was quite rightly dropped this year, since it is not a measure of equity. Education Trust still publishes rankings of the state’s share, as the recommended means to greater equity, albeit not an end itself. But there is no statistical relationship between state share and equity: Education Trust’s top-rated states on equity (Massachusetts and New Jersey) have a low state share of funding, while some states that rely more heavily on state revenues (such as Michigan) rank low on equity.
The inequities in relying solely on local property tax are well known: state revenues are definitely needed to smooth out disparities in local tax capacity. At the same time, the drawbacks of excessive reliance on state revenue are less widely appreciated. With less local finance, local officials lose their stake in the success of education. In addition, the main sources of state revenue, income and sales taxes, are far more volatile than local revenue, so an overreliance on state funding can leave schools more vulnerable during recessions. There is likely a happy medium for state share, and the precise optimum surely varies from state to state. But rankings by state share imply that there is no happy medium: a higher share is always better. This is at least debatable. A little state funding can go a long way if it is concentrated on those districts most in need.
Equity in an Era of Adequacy
Finally, we must ask what relevance measurements of equity have if, as is increasingly asserted, the debate is now about adequacy. Are there constitutional funding obligations to bring student achievement up to specified standards? Even if there is perfect equity, the adequacy argument says, funding may still be lacking.
So far, however, the difficulty in linking resources to outcomes has made the adequacy debate more contentious than enlightening. The methodologies typically used-such as the “professional judgment” model, based on educators’ opinions, rather than on data on actual spending and outcomes-are deeply flawed (see “No Money Left Behind: Exploring the Costs of Accountability,” Education Next, Spring 2004). And although some courts (such as New York) use such methods, the results are so widely at odds with one another that Education Week wisely concluded it had no sound basis on which to rank states by adequacy.
Some judges rely on purported measures of adequacy that are in fact an equity standard in disguise. Other judges turn directly to comparisons of plaintiff districts with rich districts, which is to say equity. Massachusetts’s recently concluded litigation in the Hancock case (see my sidebar, this issue, page 28) is a good example of how equity and adequacy measures can play out in court. After prevailing in court in 1993 on equity grounds, plaintiffs sought further relief in 1999 on adequacy grounds. Equity is irrelevant, the plaintiffs now argued, if funding is inadequate. But their adequacy studies provided no evidence of a causal link between spending and outcomes. The commonwealth’s highest court, citing huge increases in spending since 1993 and sharp improvement on equity measures quite similar to those used by Education Trust, rejected the complaint earlier this year.
In short, the death of equity has been exaggerated. Equity measures will surely continue to play a role in public discourse, as indeed they should for a society that values equal opportunity. The equity-rankings industry should examine its performance and make the changes necessary to provide the public with an accurate barometer. In this tale of two rankings, it may well be a far, far better thing to give certain measures the ax.
Robert Costrell is chief economist for the Commonwealth of Massachusetts and professor of economics on leave from the University of Massachusetts at Amherst.