
In February 2012, the New York Times took the unusual step of publishing performance ratings for nearly 18,000 New York City teachers based on their students’ test-score gains, commonly called value-added (VA) measures. This action, which followed a similar release of ratings in Los Angeles last year, drew new attention to the growing use of VA analysis as a tool for teacher evaluation. After decades of relying on often-perfunctory classroom observations to assess teacher performance, districts from Washington, D.C., to Los Angeles now evaluate many of their teachers based in part on VA measures and, in some cases, use these measures as a basis for differences in compensation.
Newspapers that publish value added measures no doubt relish the attention they generate, but the bigger question in our view is whether VA should play any role in the evaluation of teachers. Advocates argue that the use of VA measures in decisions regarding teacher selection, retraining, and dismissal will boost student achievement, while critics contend that the measures are a poor indicator of teacher quality and should play little if any role in high-stakes decisions. The Obama administration has thrown its weight squarely behind the advocates, launching a series of programs that encourage states to develop evaluation systems based substantially on VA measures.
The debate over the merits of using value added to evaluate teachers stems primarily from two questions. First, do VA measures work? In other words, do they accurately capture the effects teachers have on their students’ test scores? One concern is that VA measures will incorrectly reward or penalize teachers for the mix of students they get if students are assigned to teachers based on characteristics that VA analysis typically ignores.
Second, do VA measures matter in the long run? For example, do teachers who raise test scores also improve their students’ outcomes in adulthood or are they simply better at teaching to the test? Recent research has shown that high-quality early-childhood education has large impacts on outcomes such as college completion and adult earnings, but no study has identified the long-term impacts of teacher quality as measured by value added.
We address these two questions by analyzing school-district data from grades 3–8 for 2.5 million children, linked to information on their outcomes as young adults and the characteristics of their parents. We find that teacher VA measures both work and matter. First, we find that VA measures accurately predict teachers’ impacts on test scores once we control for the student characteristics that are typically accounted for when creating VA measures. Second, we find that students assigned to high-VA teachers are more likely to attend college, attend higher-quality colleges, earn more, live in higher socioeconomic status (SES) neighborhoods, and save more for retirement. They are also less likely to have children during their teenage years.
Teachers in all grades from 4 to 8 have large impacts on their students’ adult lives. On average, a 1-standard-deviation improvement in teacher value added (equivalent to having a teacher in the 84th percentile rather than one at the median) in a single grade raises a student’s earnings at age 28 by about 1 percent. Replacing a teacher whose value added is in the bottom 5 percent with an average teacher would increase students’ total lifetime incomes by more than $1.4 million for a typical classroom (equivalent to $250,000 in present value). In short, good teachers create substantial economic value, and VA measures are useful in identifying them.
Our findings address the three main critiques of VA measures raised in a recent Phi Delta Kappan article by Stanford education professor Linda Darling-Hammond and her colleagues. We show directly using quasi-experimental tests that standard VA measures are not biased by the students assigned to each teacher. Hence, value-added metrics successfully disentangle teachers’ impacts from the many other influences on student progress. We also show that although VA measures fluctuate across years, they are sufficiently stable that selecting teachers even based on a few years of data would have substantial impacts on student outcomes such as earnings.

Data
We draw information from two sources: school-district records on students and teachers, and information on the same students and their parents from administrative data sources such as tax records. The school-district data contain student enrollment history, test scores, and teacher assignments from the administrative records of a large urban school district. These data span the school years 1988–89 through 2008–09 and cover roughly 2.5 million children in grades 3 through 8.
The school-district data include approximately 18 million test scores. Test scores are available for English language arts and math for students in grades 3–8 from the spring of 1989 to 2009. In the early part of the sample period, these tests were specific to the district, but by 2005–06 all tests were statewide, as required under the No Child Left Behind law. In order to calculate results that combine scores from different tests, we standardize test scores by subject, year, and grade. The district data also contain other information on students, such as race or ethnicity, gender, and eligibility for free or reduced-price lunch (a standard measure of poverty).
Our data on students’ adult outcomes include earnings, college attendance, college quality (measured by the earnings of previous graduates of the same college), neighborhood quality (measured by the percentage of college graduates in their zip code), teenage birth rates for females (measured by claiming a dependent born when the woman was still a teenager), and retirement savings (measured by contributions to 401[k] plans). Parent characteristics include household income, marital status, home ownership, 401(k) savings, and mother’s age at child’s birth.

Do Value-Added Measures Work?
Value-added analysis aims to isolate the causal effects teachers have on student achievement by comparing how well their students perform on end-of-year tests relative to similar students taught by other teachers. These comparisons take into account students’ test scores in the prior year as well as their race or ethnicity, gender, age, suspensions and absences in the previous year, whether they repeated a grade, special education status, and limited English status. We also control for teacher experience as well as for class and school characteristics, including class size and the academic performance and demographic characteristics of all students in the relevant classroom and school.
Many other researchers use methods for measuring teacher value added that are similar to ours, so it is not surprising that we obtain similar results. For example, we find that a 1-standard-deviation increase in teacher value added corresponds to increases in student math and English scores of 12 and 8 percent of a standard deviation, respectively. In both subjects, this difference is equivalent to approximately three months of additional instruction.
Can we take this as evidence of teachers’ causal impact on student test scores? Recent studies by economists Thomas Kane, Doug Staiger, and Jesse Rothstein, among others, have reached divergent conclusions about whether VA measures should be interpreted in this way. In particular, critics contend that VA measures are likely to be biased as a result of the way that students are assigned to teachers. For example, some teachers might be consistently assigned students with higher-income parents (which typically cannot be accounted for by school districts when generating VA measures because they do not collect precise data on family income). We implement two new tests to determine whether VA estimates are biased.
Our first test examines whether in fact high-VA teachers tend to be assigned students from more-advantaged families. We calculate an overall measure of parents’ socioeconomic status, combining the parental characteristics listed above. Not surprisingly, parent socioeconomic status is strongly predictive of student test scores, and, looking at simple correlations, we find that less-advantaged students do tend to be assigned to teachers with lower VA measures. However, controlling for the limited set of student characteristics available in school-district databases, such as test scores in the previous grade, is sufficient to account for the assignment of students to teachers based on parent characteristics. That is, if we take two students who have the same 4th-grade test scores, demographics, classroom characteristics, and so forth, the student assigned to a teacher with higher VA in grade 5 does not systematically have different parental income or other characteristics.
This first test shows that any bias in VA estimates due to the omission of parent characteristics that we are able to observe is minimal. The possibility remains, however, that students are assigned to teachers based on unmeasured characteristics unrelated to parent socioeconomic status. For example, principals may consistently assign their most-disruptive students to teachers whom they believe are up to the challenge. Alternatively, principals might assign these same students to their least-effective teachers, whom they are not worried about losing. Our second test seeks to determine the amount of bias introduced by this kind of sorting.
 To do so, we exploit the fact that adjacent grades of students within the same school are frequently assigned to teachers with very different levels of value added because of idiosyncrasies in teacher assignments and turnover. During our analysis period, roughly 15 percent of teachers in our data switched to a different grade within the same school from one year to the next, 6 percent of teachers moved to a different school within the same district, and another 6 percent left the district entirely. These year-to-year changes in the teaching staff at a given school generate differences in value added that are unlikely to be related to student characteristics.
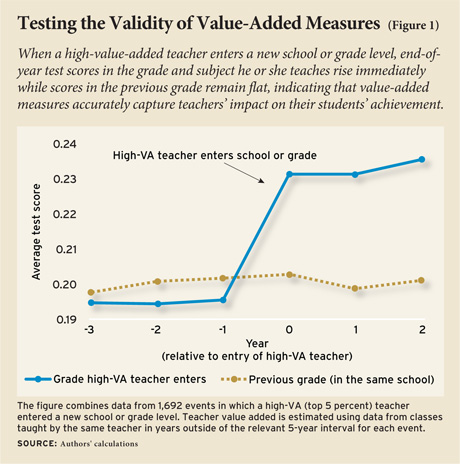
To illustrate, suppose a high-VA 4th-grade teacher enters a school at the beginning of a school year. If VA estimates capture teachers’ true impact on their students, students entering grade 4 in that school should have higher year-end test scores than those of the previous cohort. And the size of the change in test scores across these consecutive cohorts should correspond to the change in the average value added across all teachers in the grade. For example, in a school with three equal-sized 4th-grade classrooms, the replacement of a teacher with a VA estimate of 0.05 standard deviations with one with a VA estimate of 0.35 standard deviations should increase average test scores among 4th-grade students by 0.1 standard deviations.
In fact, that is exactly what we find, as shown in Figure 1. To construct this figure, we first define the top 5 percent of teachers as “high VA” and the bottom 5 percent as “low VA.” Figure 1 displays average test scores for cohorts of students in the years before and after a high-VA teacher arrives. We see that end-of-year test scores in the subject and grade taught by that teacher rise immediately by about 4 percent of a standard deviation. This impact on average test scores is commensurate in magnitude with what we would have predicted given the increase in average teacher value added for the students in that grade.
We obtain parallel findings when we examine the departure of high-VA teachers and the entry and exit of low-VA teachers. When a high-VA teacher leaves a given subject-grade-school combination, test scores of subsequent students in that subject, grade, and school fall. Likewise, students benefit from the departure of a low-VA teacher and are harmed by the arrival of a low-VA teacher.
Together, these results provide direct evidence that removing low-VA teachers (bottom 5 percent) and retaining high-VA teachers (top 5 percent) improves the academic achievement of students. But what about the remaining 90 percent of teachers? When we perform a similar analysis for all teachers, we again find that changes in the quality of the teaching staff strongly predict changes in test scores across consecutive cohorts of students in the same school, grade, and subject. Moreover, in middle schools, where students usually learn math and English from different teachers, we confirm that the arrival or departure of math teachers affects math scores but not English scores (and vice versa).
Using these techniques, we can calculate the amount of bias in our VA estimates. We find that the degree of bias is, on average, less than 2 percent. We therefore conclude that standard VA estimates accurately capture the impact that teachers have on their students’ test scores. Although the results could differ in other settings, our method of using natural teacher turnover to evaluate bias in VA estimates can be easily implemented by school districts to evaluate the accuracy of their VA models.
Do Value-Added Measures Matter?
Even though value-added measures accurately gauge teachers’ impacts on test scores, it could still be the case that high-VA teachers simply “teach to the test,” either by narrowing the subject matter in the curriculum or by having students learn test-taking strategies that consistently increase test scores but do not benefit students later in their lives. To address this issue, we measure the relationship between teachers’ value added and their students’ outcomes in adulthood. We compare students who were assigned high-VA vs. low-VA teachers in grades 4–8 and study their outcomes in adulthood.
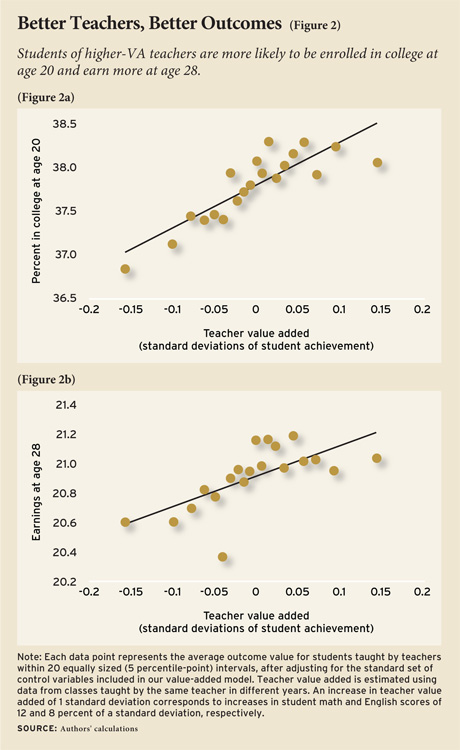
We find that high-VA teachers raise students’ chances of attending college at age 20 (see Figure 2a). A student assigned to a teacher with a VA 1 standard deviation higher is 0.5 percentage points more likely to attend college at age 20 (an increase of 1.3 percent). Students of higher-VA teachers also attend higher-quality colleges, as measured by the average earnings of previous graduates of those colleges.
A person’s income doesn’t begin to stabilize until their late twenties, so our analysis of earnings focuses on the year when students were 28, the oldest age at which we observe a sufficiently large number of students. We find that having spent a single year in the classroom of a teacher with value added that is 1 standard deviation higher increases earnings at age 28 by $182, or about 1 percent (see Figure 2b). If that 1 percent advantage were to remain stable throughout an individual’s career, it would add up to about $25,000 in total earnings.
In addition to improved earnings, we also find that improvements in teacher value added significantly reduce the likelihood that female students will have a child during their teenage years, increase the socioeconomic status of the neighborhoods in which students live in adulthood, and raise 401(k) retirement savings rates. Moreover, it is likely that improved education would yield benefits that we are not able to measure but have been shown by other studies, such as reduced crime and improved citizenship.
To sum up, our evidence confirms that the students of high-VA teachers benefit not just by scoring higher on math and reading tests at the end of the school year, but also through improved outcomes later in life. The size of these effects may seem small, but recall that they reflect the impact of a higher-VA teacher for a single year and could compound over time to the extent that students are exposed to multiple high-VA teachers. As important, a single high-VA teacher has this effect not only on a single student but rather on an entire classroom—and often on many classrooms of students over the course of a career.

Policy Implications
In a recent article (see “Valuing Teachers,” features, Summer 2011), Eric Hanushek argues in favor of dismissing the bottom 5 percent of teachers based on their VA scores. While such a policy would have many costs and benefits that are beyond the scope of our study, we can illustrate the magnitudes implied by our analysis by calculating its impacts on students’ earnings. Our estimates imply that replacing a teacher whose value added is in the bottom 5 percent with an average teacher would increase students’ cumulative lifetime income by a total of $1.4 million per classroom taught. This gain is equivalent to $267,000 in present value at age 12, discounting at a 5 percent interest rate. However, it is important to realize there is uncertainty in VA measures, which are estimates that may be based on only a few classrooms of students, so the gains from removing teachers identified as ineffective based on a limited number of years of data are smaller. We estimate the gains from “deselecting” the bottom 5 percent of teachers to be approximately $135,000 in present value based on one year of data and $190,000 based on three years of data. These benefits, while still large, would have to be weighed against any costs associated with the policy, such as teachers demanding higher pay to compensate them for the risk of dismissal.
We also measure the expected gains from policies that pay higher salaries or bonuses to high-VA teachers in order to increase retention rates. The gains from such policies appear to be only somewhat larger than their costs. Although the benefit from retaining a teacher whose value added is at the 95th percentile after three years is nearly $200,000 per year, most bonus payments end up going to high-VA teachers who would have stayed even without the additional payment. Replacing low-VA teachers is therefore likely to be a more cost-effective strategy to increase teacher quality in the short run than paying to retain high-VA teachers. In the long run, higher salaries could attract more high-VA teachers to the teaching profession, a potentially important benefit that we do not measure here.
While these calculations illustrate the magnitudes of teachers’ impacts on students, they do not by themselves offer a blueprint for the design of optimal teacher evaluations, salaries, or merit-pay policies. Teachers were not evaluated based on test scores in the school district and time period we study. VA measures may not be as useful for identifying teachers with positive long-term impacts on their students if teachers respond to their use in evaluation systems by engaging in practices such as teaching to the test or even outright cheating. In addition, our analysis does not compare value added with other measures of teacher quality, like evaluations based on classroom observation, which might be even better predictors of teachers’ long-term impacts than VA scores.
In summary, our research demonstrates that good teachers are of great value to their students, and that VA measures are a potentially valuable tool for measuring teacher performance. The most important lesson we draw is that finding policies to raise the quality of teaching is likely to yield substantial economic and social benefits.
Raj Chetty is professor of economics at Harvard University. John N. Friedman is assistant professor of public policy at Harvard Kennedy School. Jonah E. Rockoff is associate professor of business at Columbia University’s Graduate School of Business. For further information on the study, see http://obs.rc.fas.harvard.edu/chetty/value_added.html.
Commentary
In light of the widespread attention given to the Chetty, Friedman, and Rockoff research, Education Next asked four experts to comment on the study’s implications for teacher policy.
Implications for Policy Are Not So Clear – By Douglas Harris
Profound Implications for State Policy – By Chris Cerf and Peter Shulman
More Evidence Would Be Welcome – By Dale Ballou
Low-Performing Teachers Have High Costs – By Eric A. Hanushek
This article appeared in the Summer 2012 issue of Education Next. Suggested citation format:
Chetty, R., Friedman, J.N., and Rockoff, J.E. (2012). Great Teaching: Measuring its effects on students’ future earnings. Education Next, 12(3), 58-64.