 As high-school students plan for graduation and beyond, many families are counting on their local college or university as an affordable next step. But years of rising tuition costs have made that more financially challenging. The average annual net price of a four-year public college, after grants and scholarships, doubled in inflation-adjusted terms from $2,180 in 1997–98 to $4,140 in 2017–18. Including room and board, the average net price increased by $5,660 over this period to $14,940—or nearly $60,000 for a four-year degree.
How did State U. get so expensive? A leading culprit is reduced state support. Since 1987, the typical student at a public college or university has seen the government subsidy for her education drop by $2,337, or roughly one quarter. And in prior research, I found that every $1,000 in state divestment leads colleges to raise tuition by about $300. But what explains falling state support?
In this analysis, I look at state spending decisions over the past 30 years to determine the relationship between state higher-education funding declines and increases in other categories. While we cannot account for every dollar of tuition increases, we can track state spending to see which programs are getting state and local tax dollars, and how that has contributed to declines in higher-education support.
I find that state and local public-welfare spending is easily the dominant factor driving budget decisions, with a $1 increase per capita associated with a $2.44 decrease in per-student higher-education funding—enough to explain the entire average national decline. In particular, my analysis finds that state Medicaid spending is the single biggest contributor to the decline in higher-education funding at the state and local level.
Some have argued that shifting costs to those pursuing a higher degree is appropriate, given the fact that students are disproportionately from higher-income families and are likely to receive ample returns on their higher-education investments. But it can also be said that investing in higher education benefits society as a whole, and that is the matter state policymakers need to focus on. I take no position here on the “best” allocation of state funds but merely seek to document the tradeoffs facing state and local governments.
A Complex Funding Picture
Not all higher-education spending is equally productive, and there have been plenty of eyebrow-raising investments making headlines in recent years. Building a climbing wall, lazy river, or laser-tag area for students to enjoy in their downtime, for example, probably has a different impact than spending the same amount to hire more tenure-track faculty. But the weight of the evidence suggests that, at least on average, public spending on universities leads to both desirable outcomes for students and faster economic growth. College graduates are far more likely to be employed and earn, on average, $32,000 more per year than adults with only a high-school diploma. Degree holders also pay far more in taxes and cost less in public-welfare spending over their lifetimes, with bottom-line estimates ranging from $250,000 to $500,000 per person.
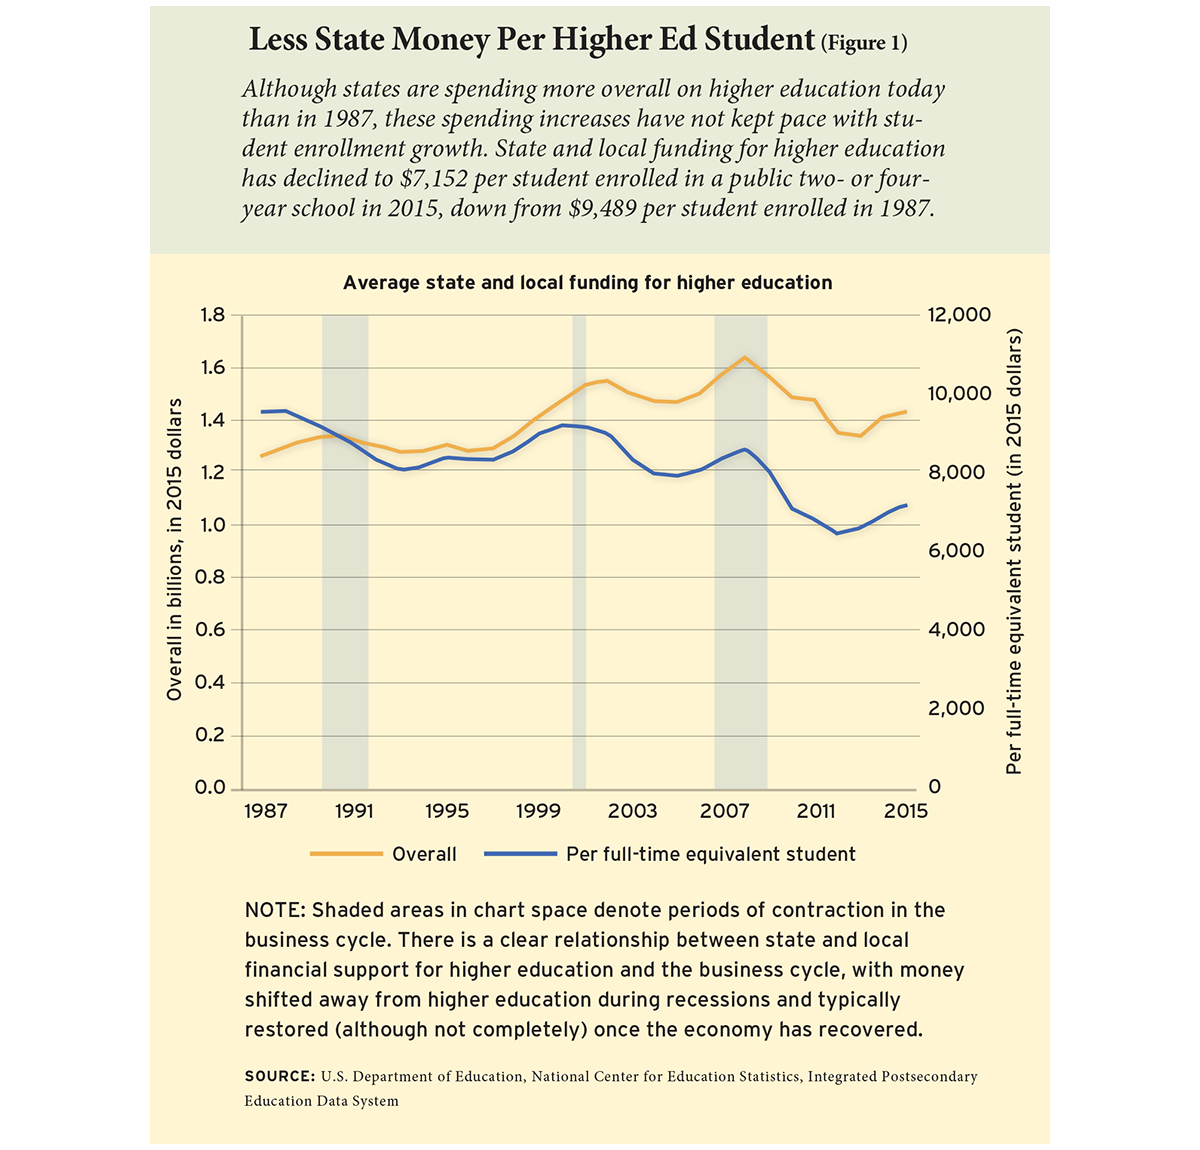
Still, in the past three decades, average state and local funding per enrolled student has dropped by one quarter, or $2,337 (see Figure 1). In 1987, states spent $9,489 per student enrolled in a public two- or four-year school, on average. By 2015 that figure had fallen to $7,152—a modest recovery from a recent low of $6,441 per student in the wake of the Great Recession in 2012. These data include state and local funding, both of which support general operating costs of public institutions. State funding, which comes from the legislature via the state budget, is more often directed toward four-year institutions, while local spending, typically a dedicated education tax, is directed to two-year institutions.
Despite the marked decline in funding per student, it isn’t completely accurate to say that states are spending less on higher education; in fact, total state and local spending increased by 13.5 percent (in inflation-adjusted terms) from 1987 to 2015 nationwide. The problem is that the student population increased far more rapidly than state spending during that time, growing by 57.4 percent. Student contributions to colleges’ and universities’ revenues have increased during this time as a share of the total. By 2012, students’ tuition accounted for 25 percent of public college and university revenues, compared to 30 percent from state and local funds.
So long as the primary costs and method of delivery in higher education are based on labor, per-student appropriations will be the correct way to assess the magnitude of public support. Although there are likely efficiency gains associated with increasing scale at small institutions, these institutions are overwhelmingly private and are not representative of where most students attend college. The majority of the new students in higher education over the past several decades attend large public institutions, which have long since exhausted their economies of scale. In other words, the marginal cost of educating a school’s 25,000th student is roughly the same as the cost of educating student number 35,000.
Moreover, the consequences for public higher education are the same regardless of whether the numerator or denominator of per-student funding is to blame for the decline. Schools are being asked to do the same thing they have been doing (or more, as is the case in states that have tied funding to performance measures) with less support. When enrollments are rising, however, the dilemma faced by state governments is even more difficult, as maintaining the same level of funding per student necessitates either raising taxes or reducing other types of expenditures.
Trends in Other State Spending
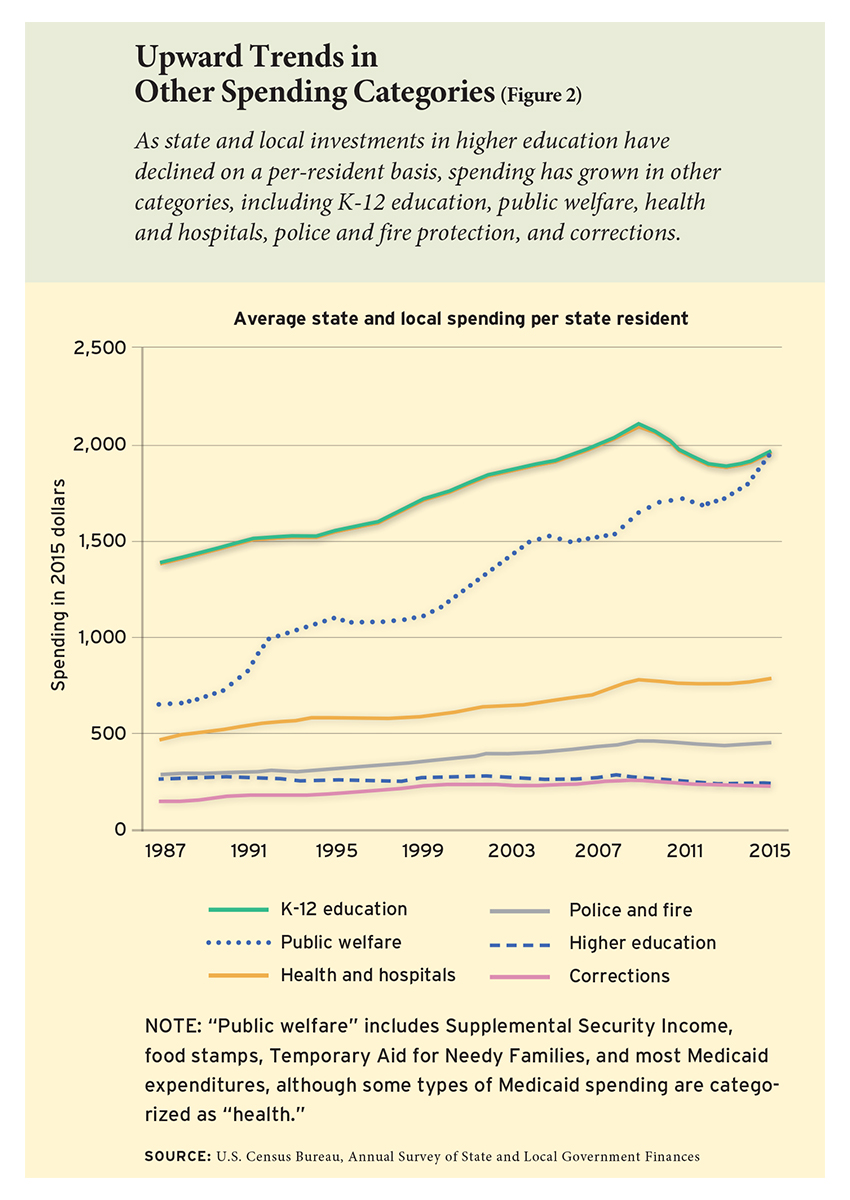 Each year during budget season, the challenge for state and local officials is to allocate their resources to the uses that will have the highest return on investment for society. While justifying investment in higher education is not difficult, its support has nonetheless shrunk, while average per-resident spending in other major categories has increased (see Figure 2).
The spending categories frequently cited as potential contributors to that decline are: K–12 education; public welfare (which includes most Medicaid spending, Supplemental Security Income, food stamps, and Temporary Assistance for Needy Families); health and hospitals; police and fire protection; and corrections. To assess the trends in these funding streams, I review data on state and local appropriations for higher education from the Integrated Postsecondary Education Data System (IPEDS), and data for all other spending categories from the Annual Survey of State and Local Government Finances.
Based purely on the national trends, spending on K–12 education and public-welfare programs would appear the leading factors: on average, K–12 education spending per state resident increased by 41 percent, from $1,378 in 1987 to $1,946 in 2015, and public-welfare spending nearly tripled, growing from $645 per resident to $1,930. Spending in other major categories also accelerated sharply during that time, though their relatively lower costs have been less consequential for state and local budgets overall: health and hospital spending increased 67 percent, from $465 to $777 per resident; police and fire protection grew 59 percent, from $284 to $450; and corrections grew 66 percent, from $134 to $222.
State and local higher-education appropriations as measured by the IPEDS data offer the best approximation of the resources provided to institutions for the purpose of furnishing educational services to the public, but they do not capture all transfers of resources between state and local governments and higher education. In particular, they do not include grants or contracts that are earmarked for specific services institutions provide, such as commissioned research projects, agricultural service from land grant institutions, or sponsored training programs. In addition, any spending by colleges and universities is typically classified as state spending because public institutions are an extension of government, even though much of their spending is funded by tuition.
This underscores the difficulty in describing the financial link between institutions and the government: not including grants and contracts understates the subsidy that students receive, but including them would certainly overstate the subsidy. Incorporating this category of transfers does not alter the conclusions of the analyses reported below, but it does increase the implied level of government spending on higher education by 10 to 20 percent.
Where Did Higher-Education Funding Go?
Did expansion in other funding categories “cause” the decline in higher-education spending? National data can’t answer that question. Just because one type of expenditure is trending upward nationwide, on average, while per-student higher-education spending is declining, it is not necessarily true that one “caused” the other. For example, it could be the case that higher-education spending is falling and K–12 spending is rising, but that states with the largest K–12 increases aren’t the same ones cutting higher-education spending.
To shed light on the actual tradeoffs states are facing, I use state-by-state data from 1987 to 2015 to measure the relationship between higher-education appropriations per student and expenditure levels in nine categories: K–12 education, public welfare, health, police and fire protection, corrections, highways and roads, utilities, sanitation, and interest payments on debt. I then use the estimated relationship between each expenditure category and higher-education support, combined with the actual changes over time in each group, to assess how much of the decline in appropriations for higher education is due to each category. I do not control for any other factors, such as the condition of the economy, because doing so would obscure the relationship with higher education spending of any categories that tend to flucuate with the business cycle.
 In essence, this is an accounting exercise that takes advantage of the fact that each state’s budget is effectively a zero-sum game. The results should not be considered causal in the sense of using what happened in the past to predict future events. For instance, a finding of a strong relationship between spending on public welfare and higher education would suggest that money that was previously spent on supporting higher education was shifted to support welfare programs in years past. But it would not necessarily tell us what could happen next year if welfare spending were to increase again.
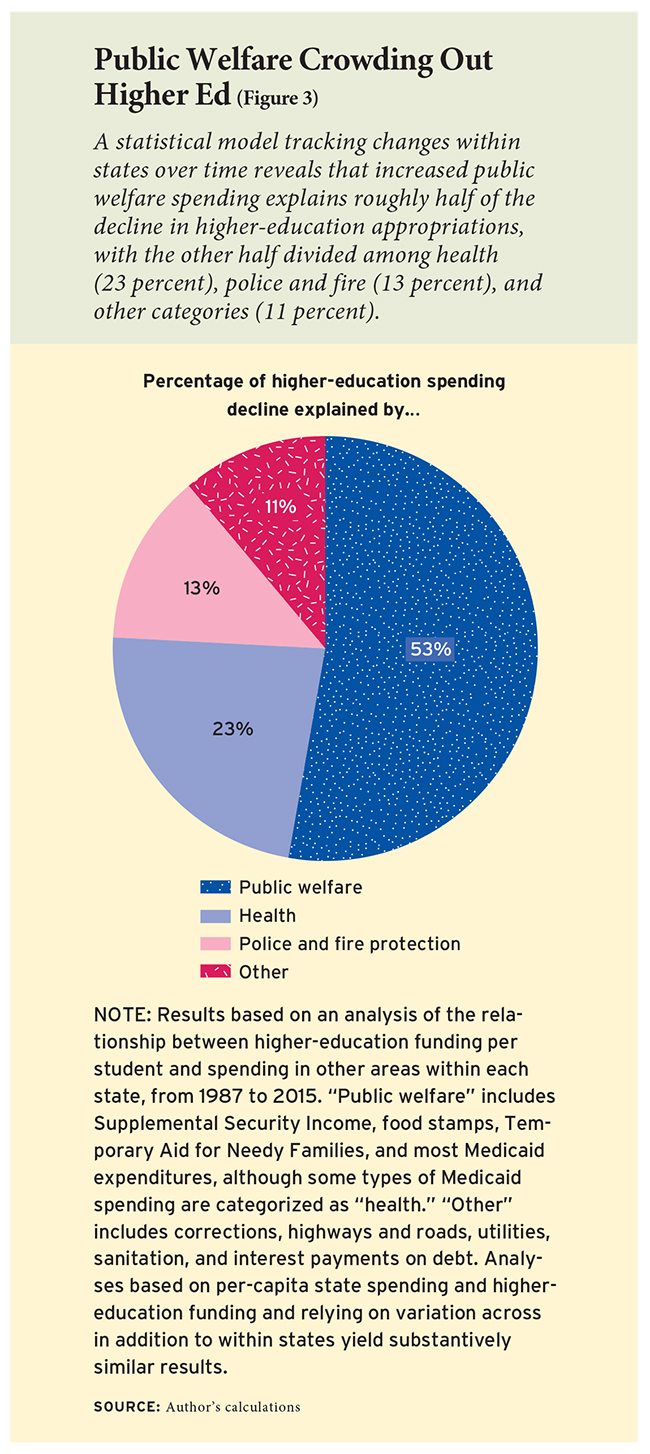
The results of my preferred analysis indicate that public-welfare spending in fact explains roughly half of the post-1987 decline in higher-education appropriations, with health accounting for another 23 percent (see Figure 3). Police and fire protection explain 13 percent of the decline, with another 11 percent from the other spending categories of corrections, highways and roads, utilities, sanitation, and interest payments on debt.
Across multiple changes to my methodology, public welfare spending is always the dominant factor, accounting for between 53 percent and 100 percent of the decline in higher-education support. For example, looking at spending per capita within each category rather than total spending reveals that a $1 increase in per-capita public welfare spending is associated with as much as a $2.44 decrease in per-student higher-education funding. Spending on health and on police and fire protection accounts for between zero and 20 percent of the decline in higher-education funding, depending on whether spending is measured on an overall or per-capita basis.
Although it is the spending category with the second-largest overall expansion nationwide in recent decades, K–12 education spending at the individual state level is not related to declines in higher-education support. In fact, state-level changes in K–12 expenditures are positively associated with changes in spending on higher education. This isn’t surprising, as governments that see education as a priority likely value both K–12 and higher-education spending. In addition to this positive relationship, K–12 funding is financed in roughly equal proportions between the state and local levels, while public money for higher education comes mostly from states. Thus, there is no evidence that spending on higher education has been displaced by spending on K–12 education.
There are two important caveats. First, these proportions represent averages across all states. In reality, there are 50 different stories to be told about state divestment from higher education. For example, in my home state of Pennsylvania, state funding per student has declined by nearly half since 1987, from $7,609 to $3,955, which is 56 percent more than the national average decline. On the other hand, state and local support has actually grown over the past three decades in six states: Connecticut, Mississippi, Nebraska, New Mexico, Oklahoma, and Wyoming.
This same caveat applies to changes in other expenditure categories as well. Some states have increased per-capita public-welfare spending only modestly, such as $647 per resident in Utah, while other states have significantly expanded it, such as a roughly $2,000 increase in Vermont. Although aggregate averages are useful for distilling national trends into component shares, every state is unique along every dimension.
The second caveat is that the expenditure categories used in my analysis are still quite broad. Public welfare, for instance, includes four major programs, from income assistance to Medicaid to food stamps. Further complicating matters, some types of Medicaid spending are categorized as “health.” Other programs, such as food stamps, are funded jointly with the federal government. While the federal government pays for the benefits, administrative costs are split evenly with the state. (My analysis only includes the state and local portions of spending on these programs.)
The large number of different programs funded by state and local governments makes it impossible to estimate the sources of divestment from higher education at a finer level than I have done above. However, given the importance of public-welfare and health spending indicated by my findings, and the large increase in state spending on Medicaid (an increase of more than $1,000 per capita since 1987 based on figures from the Centers for Medicare and Medicaid Services), it is safe to conclude that Medicaid has been the single biggest contributor to the decline in higher-education support at the state and local level.
That said, it is unlikely that the Medicaid expansions provided for under the Affordable Care Act (ACA) are responsible for much, if any, of the decline in state higher-education funding. In states that accepted the provision, ACA expanded Medicaid coverage to all individuals with incomes less than 138 percent of the federal poverty line. Up until this year, the federal government has paid 100 percent of the costs for newly eligible individuals and maintained 50 percent cost sharing for individuals eligible for Medicaid under pre-ACA rules. This means that increases in medical costs are likely more responsible for putting stress on state budgets than increases in Medicaid enrollment. This may of course change as states start paying part of the costs of new enrollees—the share of the cost for ACA-expansion Medicaid enrollees covered by the federal government is set to decline to 90 percent in 2020—or if the federal government changes the rules governing Medicaid cost sharing.
Conclusions
There has been a gradual decline in public financial support of higher education over the past 30 years. The average state spends $2,337 less today per full-time-equivalent college student than in 1987. This divestment has been passed on to students partly in the form of higher tuition and partly through reduced spending, both of which have been shown to negatively impact students. While the public discussion around college usually focuses on the price paid by students, recent work by economists David Deming and Chris Walters suggests that declines in the amount colleges and universities spend may have a larger impact on student outcomes.
This essay asks a simple question: where did the money go? Reduced spending on higher education must go somewhere¸ and the goal of my analysis is to produce the best possible estimates of where the spending went, the degree to which changes in different categories of spending explain changes in higher-education spending per student.
In reality, there are 50 different answers to this question, but in the aggregate, states have shifted most of their former investment toward public-welfare programs, particularly Medicaid. This finding highlights the struggle state legislatures face to balance the immediate needs of today against investments in the future. Most important, it illustrates that constraining the rise of health-care costs is critical not just for those who care about health-care reform but for the public-higher-education landscape as well.
But it is important to recall that state budgets result from complicated political processes, and that new financial pressures—such as from ailing pension funds or withdrawn federal social-service support—are constantly emerging. Even when we can answer the question, “Where did the money which used to support higher education go?” there is no reason to think that the politicians of tomorrow will make the same choices as the politicians of yesterday.
Douglas Webber is associate professor in the Temple University Department of Economics and a research fellow at the Institute of Labor Economics.
This article appeared in the Summer 2018 issue of Education Next. Suggested citation format:
Webber, D. (2018). Higher Ed, Lower Spending: As states cut back, where has the money gone? Education Next, 18(3), 50-56.