See the full results of this study here.
All four sectors in K–12 education compete for the support of their customers—that is, the parents of their prospective students. Those parents have more choices today than in decades past: they may send their children to the public school automatically assigned to them by their school district, or opt for a private school, charter school, or district-run school of choice. These choices include a range of cost and convenience—and, not surprisingly, a range of customer satisfaction levels.
The assigned-school-district sector has a strong competitive advantage because assigned-district schools are free and universally available, and 76 percent of American students attend them, according to a 2012 survey by the National Center for Education Statistics (NCES), part of the U.S. Department of Education. The three choice sectors do not enjoy those advantages and enroll fewer students: 10 percent of U.S. students attend private schools, 9 percent attend district schools of choice, and 6 percent attend charters, according to NCES. The private sector has a strong disadvantage because most families must pay tuition. The charter sector has the advantage of its programs being tuition-free but is limited to operating in specific places where charters have been approved by a state-determined authorizer. Similarly, district schools of choice also are tuition-free but cannot operate in competition with assigned-district schools unless school boards specifically allow them.
To maintain and enlarge their market share, all schools of choice must satisfy the families who make use of them, who specifically opt out of the free, more convenient assigned-district alternative. So how favorably do parents rate their children’s programs? How do the choice sectors compare with one another? With which aspects of schooling are choice parents most satisfied? Do these patterns vary across different segments of the population? We explore these questions by comparing parental satisfaction ratings for all four sectors: assigned-district schools, private schools, charter schools, and district schools of choice.
Data and Methods
NCES has regularly gathered data on the educational activities of the U.S. population since 1991 through its National Household Education Surveys Program. In 2012, it administered the “Parent and Family Involvement in Education Survey” to a nationally representative sample of households with children enrolled in K–12 schools. Families of school-age children were mailed a questionnaire asking about one of their children’s schools, and the parent most familiar with that child’s school was asked to respond. In the end, 17,166 families, representing a response rate of 58 percent, completed the survey. (An additional 397 families of home-schooled children, who are not included in survey results below, also took part.) This survey was conducted by the American Institutes for Research (AIR), and findings were released in 2015 and updated in 2016. The data were weighted so that results would be representative of the school-age population as a whole.
Among other topics, parents were asked how satisfied they were with various aspects of the school their child attended, including the school overall, the teachers their child had that year, academic standards, order and discipline, and the way the school staff interacted with parents. Respondents were given the option of indicating whether they were very satisfied, somewhat satisfied, somewhat dissatisfied, or very dissatisfied.
In their initial report, AIR and NCES researchers divided parents into four categories: parents with a child at an assigned district-operated school, and parents with a child at one of three types of chosen schools; either a public school that they chose (including district-operated schools and charter schools), a religiously affiliated private school, or a private school that did not have a religious affiliation. Students were classified as attending a chosen school if the parent indicated that their child attended a private school or if the parent indicated that their child attended a public school but also responded “No” to the question: “Is [this public school] [your child’s] regularly assigned school?” Some 76 percent attended an assigned public school, 14 percent attended a chosen public school (including charter schools), and 10 percent attended either a religiously affiliated or secular private school.
Charter-school parents are 39 percent of families using chosen public schools and 6 percent of all students in the sample. By separating out these students (most of whom were presumably attending 1 of the 5,274 charter schools operating across the U.S. in 2011), we are able to compare parent satisfaction of students at charter schools with students in private schools, assigned-district schools, and choice district schools.
Those choice district schools, which are attended by the 9 percent of students in chosen public schools who did not attend charters, cannot be further classified by type. We know only that the parent filling out the questionnaire said the school had not been assigned to their child by the district. These chosen district schools largely comprise the country’s 2,722 “magnet” schools (according to 2011 data), most of which offer themed programs and were originally designed to encourage desegregation by attracting a multi-racial clientele. In addition, they likely include some of the estimated 165 competitive “examination schools” like Stuyvesant High School in New York City, a district-run school that offers accelerated academic programs for students who meet rigorous entry standards. District schools also could be chosen when families participate in open enrollment or inter-district choice programs, which allow students in one school district to attend schools in another, often as part of a voluntary desegregation strategy. A few cities, such as Denver and Boston, have quasi–open enrollment plans that allow families to rank the preferred choices for their children’s school rather than following automatic assignments. Whether magnet, exam, or open-enrollment schools, one may infer that many of these chosen schools were selected by parents for the superior educational opportunities they seemed to offer.
Findings on School Composition
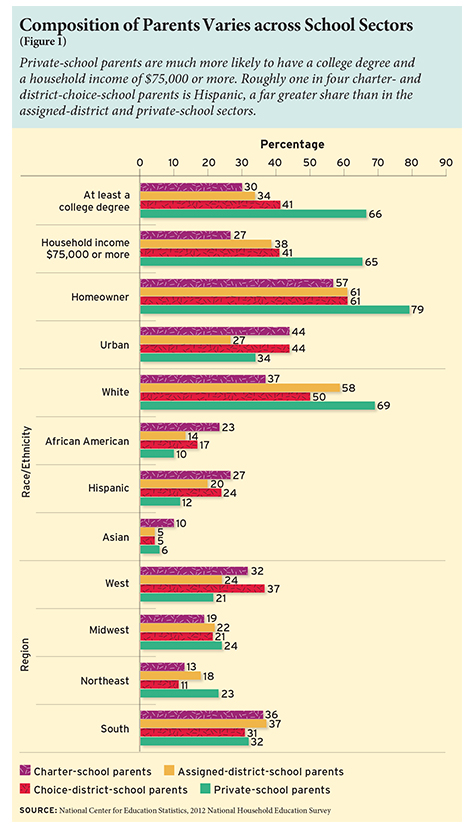 Family demographics vary among the four different school sectors, with larger shares of African American and Hispanic students at tuition-free charters and district schools of choice than at private schools or assigned-district schools (Figure 1). Hispanics account for 27 percent of families at charters, 24 percent at district schools of choice, 20 percent at assigned-district schools, and 12 percent at private schools. African American students account for 23 percent of students at charters, 17 percent at district schools of choice, 14 percent at assigned-district schools, and 10 percent at private schools.
Compared to other sectors, charter-school parents report much lower family incomes and private-school parents report much higher incomes. Charter-school parents are also the least likely to have earned a college degree. Nearly half of charter-school and district-choice-school parents live in urban areas, compared to one-third of private-school parents and one-quarter of families whose children attend assigned-district schools. Parents at charters and district schools of choice are more likely to live in the West.
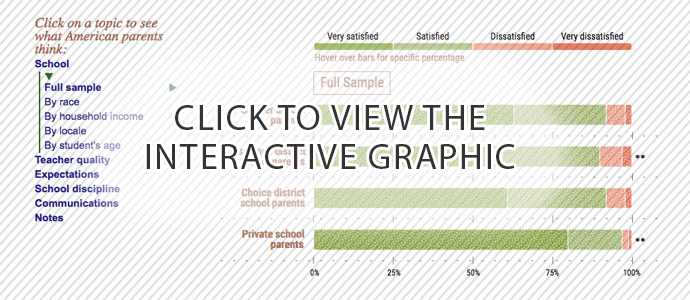
Adjustment for demographic differences. On the web site of the Harvard Program on Education Policy and Governance (https://www.hks.harvard.edu/pepg/), we present our unabridged analysis, including estimates of sector differences in satisfaction that adjust for the variation in the demographic background of parents across sectors. The statistical significance of these adjusted differences as shown in Figures 2 and 3 are estimated by models that take into account the entire distribution of responses (e.g., very satisfied, somewhat satisfied, somewhat dissatisfied, or very dissatisfied). However, for ease of presentation in the text and figures that follow, we simply report the percentage of parents in each sector who say they are “very satisfied” with a particular aspect of their child’s school. An interactive graphic at www.educationnext.org provides additional information.
Findings on Parental Satisfaction
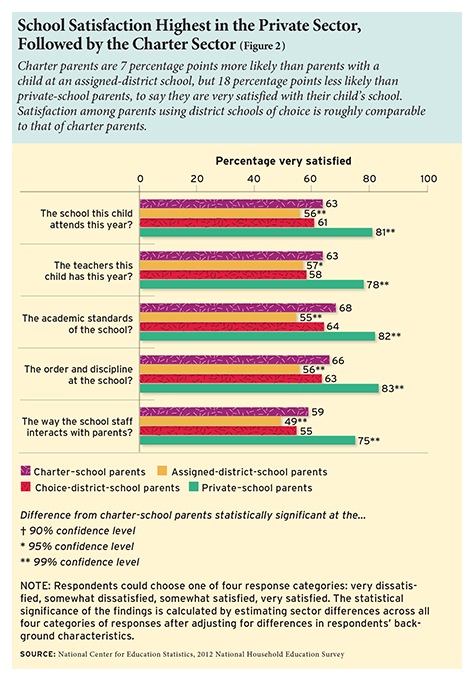 Although parents in all four sectors report high levels of satisfaction with their child’s school, the percentage saying they are “very satisfied” varies by school type. Satisfaction levels are the highest among private-school parents, with parents at charter schools and district schools of choice reporting lower, but similar, rates of satisfaction (Figure 2). Among the four sectors, parents of students attending assigned-district schools are the least likely to say they are “very satisfied” with their child’s school.
Charter schools vs. other sectors. Charter-school parents report higher satisfaction levels than parents with children in assigned-district schools. The size of that difference varies, however, depending on the specific aspect of the school under consideration. Compared to parents at assigned-district schools, charter-school parents are 6 percentage points more likely to say they are “very satisfied” with teachers at the school, 13 percentage points more likely to be “very satisfied” with academic standards, and 10 percentage points more likely to be “very satisfied” with both school discipline and communication with families.
Charter-school parents also report slightly higher levels of satisfaction than parents whose children attend a district school of choice. However, the differences, which vary between 2 percentage points and 5 percentage points, are not statistically significant.
Charter-school parents report lower levels of satisfaction than parents of children at private schools. Differences in satisfaction levels vary between 14 percentage points and 18 percentage points, depending on the aspect of the school.
Lowest- vs. highest-income groups. Parent satisfaction levels vary by household income, with large differences observed for families with incomes of $30,000 or less and those with incomes of $100,000 or more (Figure 3). High-income parents are more likely than low-income parents to express satisfaction with charter schools: 72 percent say they are “very satisfied” with their child’s school compared to 62 percent of low-income parents. We find a similar pattern for the other four aspects of the school—teacher quality, academic standards, discipline, and communication.
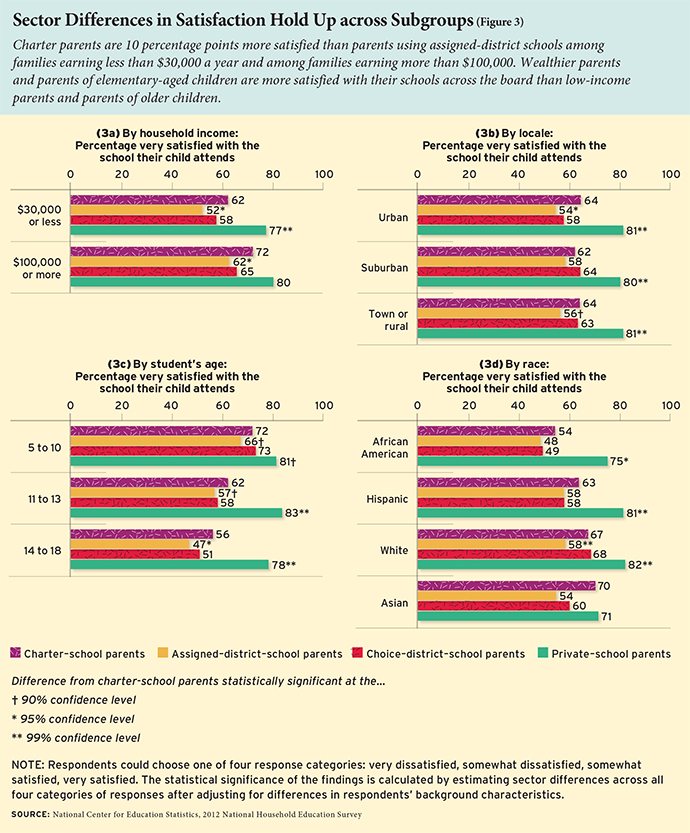
Despite these differences, both low- and high-income parents whose children attend charter schools are considerably more satisfied than comparable parents at assigned-district schools. When asked to assess the school itself, the share of low-income parents saying they are “very satisfied” is 10 percentage points higher at charters than at assigned-district schools. For high-income parents, this difference is also 10 percentage points. Averaging across all five assessment indicators, the percentage of low-income parents saying they are “very satisfied” is 9 percentage points higher at charters than at assigned-district schools. Among high-income parents, that difference is 14 percentage points.
Parental satisfaction with charter schools and district schools of choice is similar for both low- and high-income families. These differences are not statistically significant. Both high- and low-income families express higher levels of satisfaction with their school if it is in the private sector rather than the charter sector. The difference in satisfaction levels between a charter school and a private school is 15 percentage points for low-income families and 8 percentage points for high-income families. The latter difference is not statistically significant. Averaging across all indicators, the difference in the share of low-income families who are “very satisfied” with aspects of their child’s private school is 25 percentage points, which is similar to the difference of 22 percentage points among high-income families. This suggests that school vouchers or other programmatic interventions that expand families’ access to private schools have a good chance of boosting levels of parental satisfaction.
Age of student. Because the data include information about students’ ages, we are able to compare degrees of satisfaction by grade span in each sector. Students age 10 and under are assumed to be attending elementary schools, those age 11 to 13 are assumed to be in middle school, and those who are 14 to 18 are assumed to be in high school. These estimates are not perfectly accurate, but even this rough classification system allows for estimates of the extent to which parental assessments vary by their child’s grade level.
We find that charter-school parents of elementary-age children are more satisfied with their school than parents whose children are in middle or high school. Whereas 72 percent of those with an elementary-age child are “very satisfied,” only 62 percent of those with children in the middle-school years and just 56 percent of parents of students in high school are similarly satisfied. However, for all three age groups, charter-school parents are more satisfied than parents at assigned-district schools. By student age, charter-school parents are more likely to report they are “very satisfied” with their school by 6, 5, and 9 percentage points, respectively, compared to parents whose children attend an assigned-district school. Across all five satisfaction indicators, the differences are, on average, 8, 5, and 11 percentage points for parents of children at the three age levels, respectively. In other words, the charter advantage, from the perspective of parents, is at least as great at the high-school level as at the elementary level. If charters want to mobilize parental support, they might consider greater investments in the final years of schooling.
Urban, suburban, and rural regions. One finds little variation in the degree of satisfaction with charter schools by region: across the country, more than 60 percent of parents in urban, suburban, and rural communities say they are very satisfied with the charter school that their child is attending. However, the charter-school advantage vis-à-vis assigned-district schools is somewhat greater in urban and rural settings than in suburban ones. In both urban and rural communities, 64 percent of parents say they are “very satisfied” with their child’s charter school, compared to 54 percent of urban parents and 56 percent of rural parents who say they are “very satisfied” with their child’s assigned-district school. By contrast, the difference in the percentage of charter-school and assigned-district-school parents who say they are very satisfied is only 4 percentage points in suburban areas. It is worth considering, however, that suburban parents may well have already exercised school choice as part of their house-hunting process, by choosing their neighborhood based in part on where their child or future children would be assigned to go to school. Private schools generate similarly higher levels of satisfaction than choice and district schools in all three types of communities, but significant differences between charters and chosen district schools are not observed in any of the three areas.
Racial and ethnic differences. White and Asian families are clearly more satisfied with their charter schools than African American families, and somewhat more satisfied than Hispanic families. Among charter-school parents, 70 percent of Asian parents and 67 percent of white parents say they are “very satisfied,” compared to 63 percent for Hispanic parents and 54 percent for African American parents. The differences in reported levels of satisfaction between charter and assigned-district schools are wider among Asian and white families, too: for assigned-district schools, the difference is 16 percentage points for Asian families and 9 for white families, compared to a statistically insignificant 6 percentage points and 5 percentage points for African American and Hispanic parents, respectively.
Comparing levels of satisfaction among charter-school parents to parents at district schools of choice, there are no significant differences by race or ethnicity. With the exception of Asian parents, parents of all ethnicities prefer private schools to charter schools by a double-digit margin.
Interpretation
Our findings echo those reported by the 2016 Education Next survey, which examined the opinions of parents whose children attend public, charter, and private schools (see “What Do Parents Think of Their Children’s Schools?,” features, Spring 2017). That survey found that private-school parents are much happier with their children’s schools than parents at district schools. The study also found charter parents, though not as pleased as private-school parents, are more satisfied than district parents.
District schools of choice: The magnet school. When comparing satisfaction levels with charter schools to district schools of choice, it is helpful to keep in mind that magnet schools serve approximately two-thirds of the students in district schools of choice. This can be inferred from other surveys conducted by the U.S. Department of Education, which have found that 2011–12 enrollments in magnet schools constitute 2.1 million students, slightly more than the 1.8 million students attending charter schools. If parents are accurately reporting the type of school their child is attending, roughly 6 percent of all students are going to magnet schools. That implies that two-thirds of the 9 percent of all students said by parents to be attending a chosen district school are attending magnet schools.
Unlike charter schools, which usually must admit students by lottery if they are over-subscribed, many magnet schools have admission standards. Others offer specialized curricular programs that are expected to promote racial integration by attracting students from all racial and ethnic backgrounds to seek admission. According to the Schools and Staffing Survey (SASS) of 2011–12, a nationally representative survey of schools conducted by the U.S. Department of Education, 28 percent of magnet schools give admissions preferences to academically gifted students, three times the rate of charter schools. Likewise, nearly half of magnet schools (45 percent) are said to have special emphases in the performing arts, math and sciences, or foreign languages, while only 12 percent of charter schools are said to have a similar emphasis. Nearly a quarter of magnet schools report administering admissions tests as part of the application process. In contrast, only 8 percent of charter schools report doing so. Conversely, about 5 percent of charter schools are dedicated to serving students with special needs or at-risk students, whereas less than 1 percent of magnet schools do the same.
The SASS also suggests that magnet schools receive many more resources than charter schools, on average. For example, teacher salaries, even after incorporating cost-of-living adjustments, are 5 percent to 12 percent higher at magnet schools than in charter schools, on average. And almost all magnet schools have a library media center, while only half of charters do.
Despite the greater exclusivity and resource advantages enjoyed by magnet schools, parental satisfaction with magnet schools and the other district schools of choice is no greater—and may be less—than the level of satisfaction of parents with a child at a charter school. This does not demonstrate that charter schools are superior to magnet schools, as we do not have any direct evidence about school quality independent of parental perceptions. But if parental satisfaction is a desirable, policy-relevant outcome in its own right, the data suggest that charters are a viable—and perhaps the preferred—option for those seeking to expand choice within the public sector.
Private schools. By a wide margin, parents with children in the private sector express much higher levels of satisfaction than parents in the assigned-district sector. That certainly helps to explain the viability of a sector that charges tuition when other sectors are offering seemingly comparable services without charge. Private schools are also providing higher levels of satisfaction than either charter schools or district schools of choice. These choice-based schools pose a greater threat to the private sector because the differences in satisfaction level are, roughly speaking, only half as large as between private schools and the assigned-district sector. Yet the high level of satisfaction with private schools provides encouragement for those who support school voucher initiatives, which increase access to the private sector by paying some or all of students’ tuition.
Assigned-district schools. The assigned-district school, which currently provides services to 76 percent of all students, may be an endangered species. Since all three choice sectors—private, charter, and district schools of choice—are offering parents educational options that are considerably more satisfying, one must expect the market demand for educational alternatives to increase. It will take a strong political defense of the district-operated school system, which assigns children to the specific place where they are to be educated, to thwart an underlying trend toward greater choice that has gathered support among the families that are most directly affected.
Albert Cheng is a post-doctoral fellow at the Program on Education Policy and Governance (PEPG) at the Harvard Kennedy School. Paul E. Peterson, senior editor of Education Next, is professor of government at Harvard University and director of PEPG.
For a look at findings on parental satisfaction using data from the 2016 Education Next survey, see “What Do Parents Think of Their Children’s Schools?.”
This article appeared in the Spring 2017 issue of Education Next. Suggested citation format:
Cheng, A., and Peterson, P.E. (2017). How Satisfied Are Parents With Their Children’s Schools? New evidence from a U.S. Department of Education survey. Education Next, 17(2), 20-27.