 There is a substantial body of research showing that teacher quality is an important determinant of student achievement in elementary and secondary schools, inspiring some states and districts to enact policies aimed at identifying and rewarding high-quality teachers. Yet relatively little is known about the impact of instructor effectiveness on student performance in higher education, where such insights could be particularly useful. Even more than leaders at K–12 schools, college administrators often have substantial discretion to determine which instructors receive teaching assignments.
This lack of research is largely the result of data and methodological challenges. Whereas K–12 schools administer standardized tests to most students in core academic subjects, there are few such common assessments at colleges—even among students taking the same course at the same campus. In addition, college students are able to choose their classes and thus, their instructors. Because college students have a great deal of flexibility compared to students in K–12, simply comparing their success rates across instructors is likely to be misleading.
In this study, we overcome these challenges by examining data on more than 2,000 algebra instructors at the University of Phoenix (UPX), a for-profit institution that is the largest university in the United States. UPX follows a unique instructional model based on common, standardized curricula and assessments, in both online and face-to-face classes. These assessments provide an objective outcome by which to measure instructor effectiveness, and we use them to examine two questions: How much does student performance vary across instructors? And is instructors’ effectiveness correlated with their teaching experience and salary?
We find substantial variation in student performance across instructors, both in the instructor’s class and in a subsequent class. Differences are substantial in both online and in-person courses, though they are larger for in-person classes. Notably, instructor effects on students’ future course performance are not significantly correlated with student end-of-course evaluations, the primary metric through which instructor effectiveness is currently judged. Our findings suggest that colleges could improve student outcomes by paying more attention to who is teaching their classes.
Examining a Higher-Ed Hybrid
We study instructor effectiveness at UPX in a required undergraduate mathematics course for BA-seeking students, College Mathematics I (Math I, known internally at UPX as MTH/208). As with most courses at UPX, Math I classes are five weeks long and taken one at a time. UPX students take Math I after completing about eight other classes, so enrollment signifies some level of commitment to persisting in their program. The course covers basic algebra, such as linear equations, graphing, and working with exponents, and is the prerequisite for a follow-on course, Math II, which covers quadratic equations and factoring polynomial expressions. Many students struggle in these core math courses, which are regarded by UPX staff as important obstacles to obtaining a degree.
Students can take Math I online or in person; UPX currently has campuses in 30 U.S. states, as well as Washington, D.C. and Puerto Rico. Math I course sections are split about evenly between the two modes. In the face-to-face sections, students attend four hours of standard in-class lectures per week, typically on a single evening. In addition, they are required to work with their peers roughly four hours per week on what are known as “learning team” modules, as well as spend 16 additional hours outside of class reading course materials, working on assignments, and studying for exams.
Online courses are asynchronous, so students can access course materials and complete their assignments at any time. Instructors provide guidance and feedback through online discussion forums, in which students are required to post substantive comments and questions six to eight times each week. There is no synchronous or face-to-face interaction with faculty in the traditional sense, but instructors engage with students via online discussion, including redirecting students to relevant materials when necessary.
There are differences between the online and in-person courses in terms of curriculum and grading flexibility. Both courses have standardized course curricula, assignments, and tests, and grading is performed automatically through the course software. However, while online instructors mainly use these elements as provided, in-person instructors are more likely to support students with their own learning tools, administer extra exams and homework, or add other components that are not part of the standard curriculum.
Both types of instructors experience similar hiring, training, and management practices, which are controlled by a central hiring committee at the Phoenix campus with input in some cases from staff at local campuses. Qualified candidates must pass a five-week standardized training course, including a mock lecture for in-person instructors and a mock online session for online instructors. An evaluator sits in on their first class or follows an instructor’s initial online course to ensure they meet university standards. Salaries are relatively fixed, but do vary modestly with respect to degree and tenure.
For online classes, the allocation of instructors is essentially random. UPX starts about 60 sections of Math I each week, and the instructor’s name is made available to students only two to three days before the course starts, at which point students are already typically enrolled. The only way for students to sidestep these teacher assignments is to drop the course and enroll in a different week.
For in-person sections, the assignment works differently. Most UPX campuses are too small to run multiple sections of the class at the same time or even one right after the other; instead, students may need to wait for a few months if they decide to take the next Math I section at that campus. This limits students’ ability to shop around for a better teacher. However, the assignment of students to in-person sections is likely to be less random than for online classes.
UPX tracks and evaluates its instructors’ performance through annual observations by an evaluator, ongoing review of students’ grade distributions and instructors’ responsiveness on the online platform by an in-house data analytics team, and additional evaluations if students file complaints about instructor performance.
If these evaluation channels show the instructor has not met university standards, the instructor receives a warning. Instructors who have received a warning are monitored more closely in subsequent courses and may not be rehired if their performance does not improve.
Data and Methods
Data. We analyze university administrative records covering all sections of Math I and all instructors and students who have taken or taught it at least once between January 2001 and July 2014. The data include 339,844 students in 26,384 course sections, taught by 2,243 unique instructors. We also focused on a subset of data for which final exam scores are available, which includes 94,745 students in 7,232 Math I sections taught by 1,198 unique instructors. In addition, we analyzed student performance among students who pass Math I and enroll in the next required course in the sequence, Math II.
We reviewed performance data and demographic descriptors for instructors and students. For instructors, we reviewed their teaching history; self-reported information on ethnicity, gender, and residential zip code; and salary. Instructors in our study are majority white and male, have been at the university for an average of nearly five years, and earn $950 per class. They typically have taught more than 40 total course sections at UPX, including 15 sections of Math I. We calculate several experience measures for instructors, including the number of courses taught in the previous calendar year and total cumulative experience teaching, including Math I.
For students, we review course-taking histories, including grades and credits earned; demographics such as gender, age and residential zip code; and final exam scores when available. About two-thirds of students in our study are female and their average age is 35 years old. At the outset of the class, they typically have already taken 23 credits worth of classes at UPX, with an average GPA of 3.35. About 10 percent have taken (and failed to complete successfully) Math I before. Based on transcript data, we construct measures of student success, including course completion, cumulative grade point average (GPA), and cumulative credits earned, both before and after enrolling in Math I.
We also obtain end-of-course evaluations for sections between March 2010 and July 2014, in which students rate the instructor on a 10-point scale. However, student end-of-course evaluations are optional, and just 37 percent of Math I students completed them.
Methods. To measure instructor quality, we compare the outcomes of students who took the same course with different instructors, drawing on the sort of value-added model often used to measure teacher effectiveness in K–12 (see “Choosing the Right Growth Measure,” research, Spring 2014). These models take into account differences in student characteristics, and then compare the outcomes of similar students taught by different instructors on the same campus.
We account for student characteristics such as gender, age, GPA, credits earned at UPX prior to Math I, whether students have taken Math I before, the number of times they have taken the class, the years since they started their program, and the academic program in which the student was enrolled. We also control for total section enrollment, the averages of individual characteristics by section, and student zip code characteristics available through U.S. Census data, such as the local unemployment rate, median family income, percentage of families below the federal poverty line, and percentage of residents with a college degree. Finally, to account for any changes over time in unmeasured student characteristics or grading standards, we compare only students who take Math I in the same month.
Measuring instructor effectiveness accurately requires confronting three key issues: nonrandom assignment of students, variation in grading practices among instructors, and unmeasured differences across campuses.
First, could our estimates be biased by students seeking out especially skillful instructors? According to UPX administrators, there is no sorting at all in online courses, which is plausible given the very limited interaction students have with instructors in the initial meetings of the course. Some sorting in face-to-face courses is possible, but administrators believe this is minimal, as do we. On average, we find very few systematic correlations between student and instructor characteristics within individual campuses. Furthermore, the inclusion of the rich student characteristics mentioned above has little impact on our estimates of instructor value-added.
Second, student grades do reflect, at least in part, different grading practices by instructors. As a result, we also report results based on standardized final exams. This information is available for sections between July 2010 and March 2014, about 30 percent of the full sample, and we can identify final exam scores with high confidence for 88 percent of those students. We also examine future performance measures, such as students’ grades and cumulative GPAs six months and one year later. These outcomes are unlikely to be affected by individual instructors’ grading practices.
Finally, the UPX setting is unique in postsecondary education in that many instructors teach at multiple campuses, especially when the online campus is included. These campus “switchers” permit us to make performance comparisons between instructors across campuses while also controlling for cross-campus differences in unobserved student factors.
Effective Instruction Has Lasting Impacts
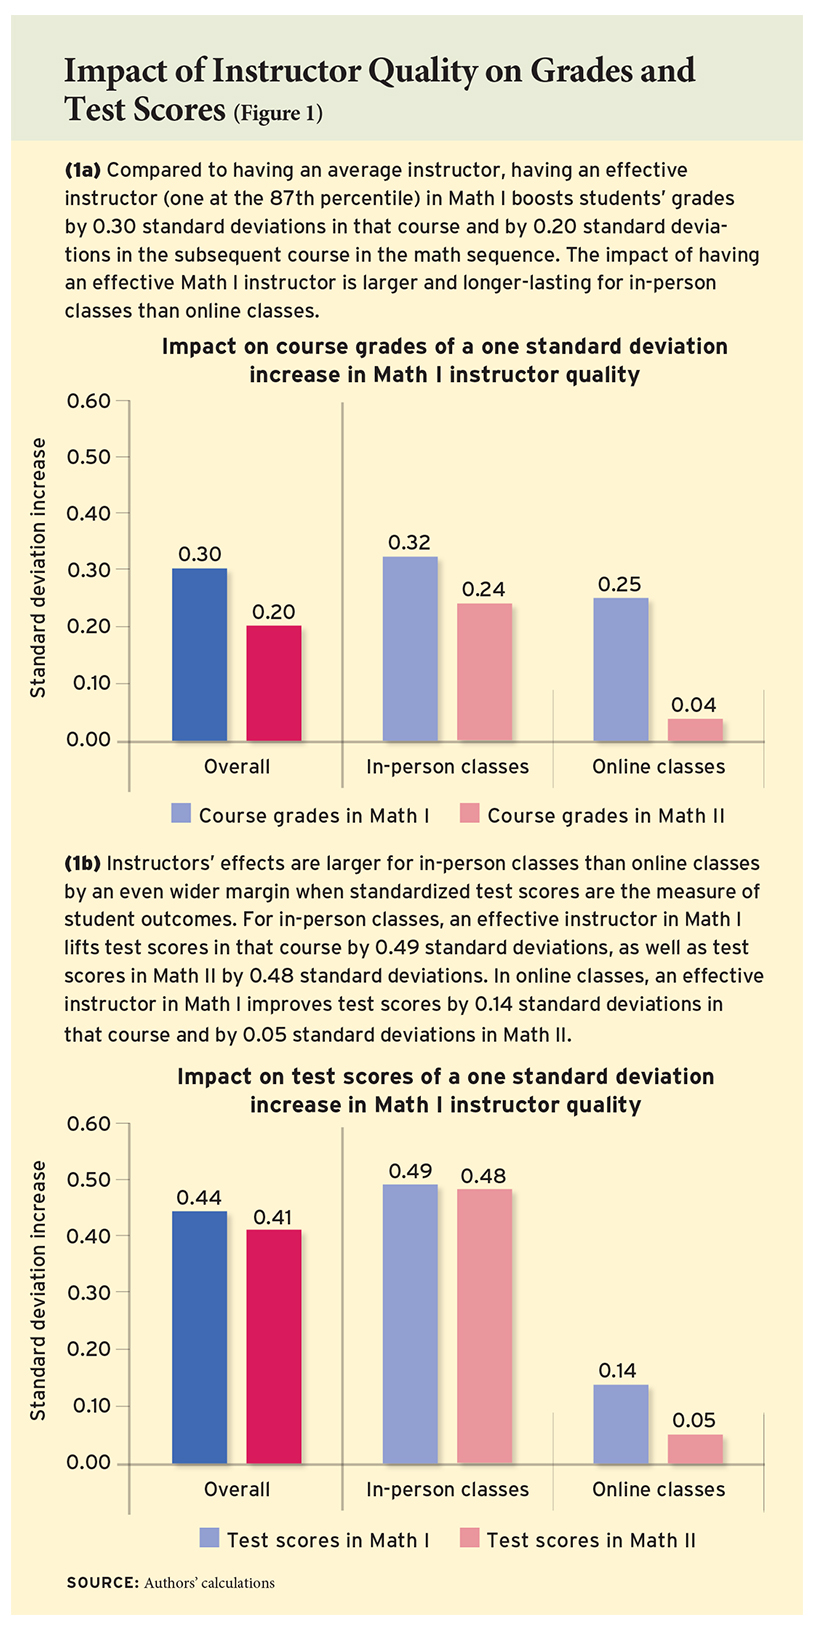 Our analysis shows that student outcomes vary considerably across instructors, both online and among those who teach the same course in person on the same campus. Students’ outcomes in Math I vary by their instructor in that class, as do their outcomes in the following Math II class. An increase of 1 standard deviation in instructor quality in Math I—equivalent to having a teacher at the 87th percentile of effectiveness rather than an average teacher—is associated with better outcomes for students, such as increases in students’ grades of 0.30 standard deviations in Math I and 0.20 standard deviations in Math II (see Figure 1). In other words, students with more-effective instructors usually get better grades, on the order of moving from a “B” to “B+.”
It’s a boost with staying power. Instructor effects on students’ grades in Math I and Math II are highly positively correlated in both formats, with a correlation coefficient of 0.60. This tells us that Math I instructors who successfully raise student performance in Math I also raise performance in follow-on courses. Instructors do not appear to be improving current performance in ways that harm longer-term learning.
We find that instructor quality is more variable among in-person sections than online. For grades in Math I, this difference is relatively modest: a one standard deviation increase in instructor quality improves grades by 0.32 standard deviations for in-person sections and by 0.25 standard deviations for online sections. However, there is a large difference by format when measuring student performance in the subsequent Math II class, where effectiveness varies by 0.24 standard deviations for in-person instructors and 0.04 standard deviations for online instructors.
There are a number of reasons that the impact of instructors may vary less in online courses than in face-to-face classes. Face-to-face instructors interact with students directly and have more discretion in amending and supplementing course materials. Online instructors, by contrast, operate under more centralized management and may not interact with their students in real time. Differences among the types of students and instructors who choose the online versus in-person setting may also be a factor.
Effects are different depending on which measure of student outcomes and course format is considered. For in-person classes, instructors’ effects on final exam scores vary more than those on course grades, with a standard deviation of 0.49 compared to 0.32. Effectiveness is highly positively correlated between current and follow-on course performance, at 0.60 for both grades and for test scores.
In online sections, both findings are reversed: the standard deviation of instructor effects on test scores is 0.14 for exam scores compared to 0.25 for grades. There also appears to be a weaker correlation with follow-on course performance for online sections for students’ final exam scores.
How big are the effects of instructor quality on students’ final exam scores? We compare them to outcome differences by student characteristics known to be important factors in their success: age and prior academic performance. On the standardized final exam, older students earn scores that are 0.15 standard deviations lower than classmates who are a decade younger. A 1-point difference in a student’s incoming GPA is associated with a difference of 0.46 standard deviations on his or her final exam score. So, having an instructor who is 1 standard deviation more effective produces a test score change that is larger than the gap between 25- and 35-year-old students, and comparable to the gap between students entering the class with a 3.0 compared to a 2.0 GPA. Instructor quality thus appears to be an important factor.
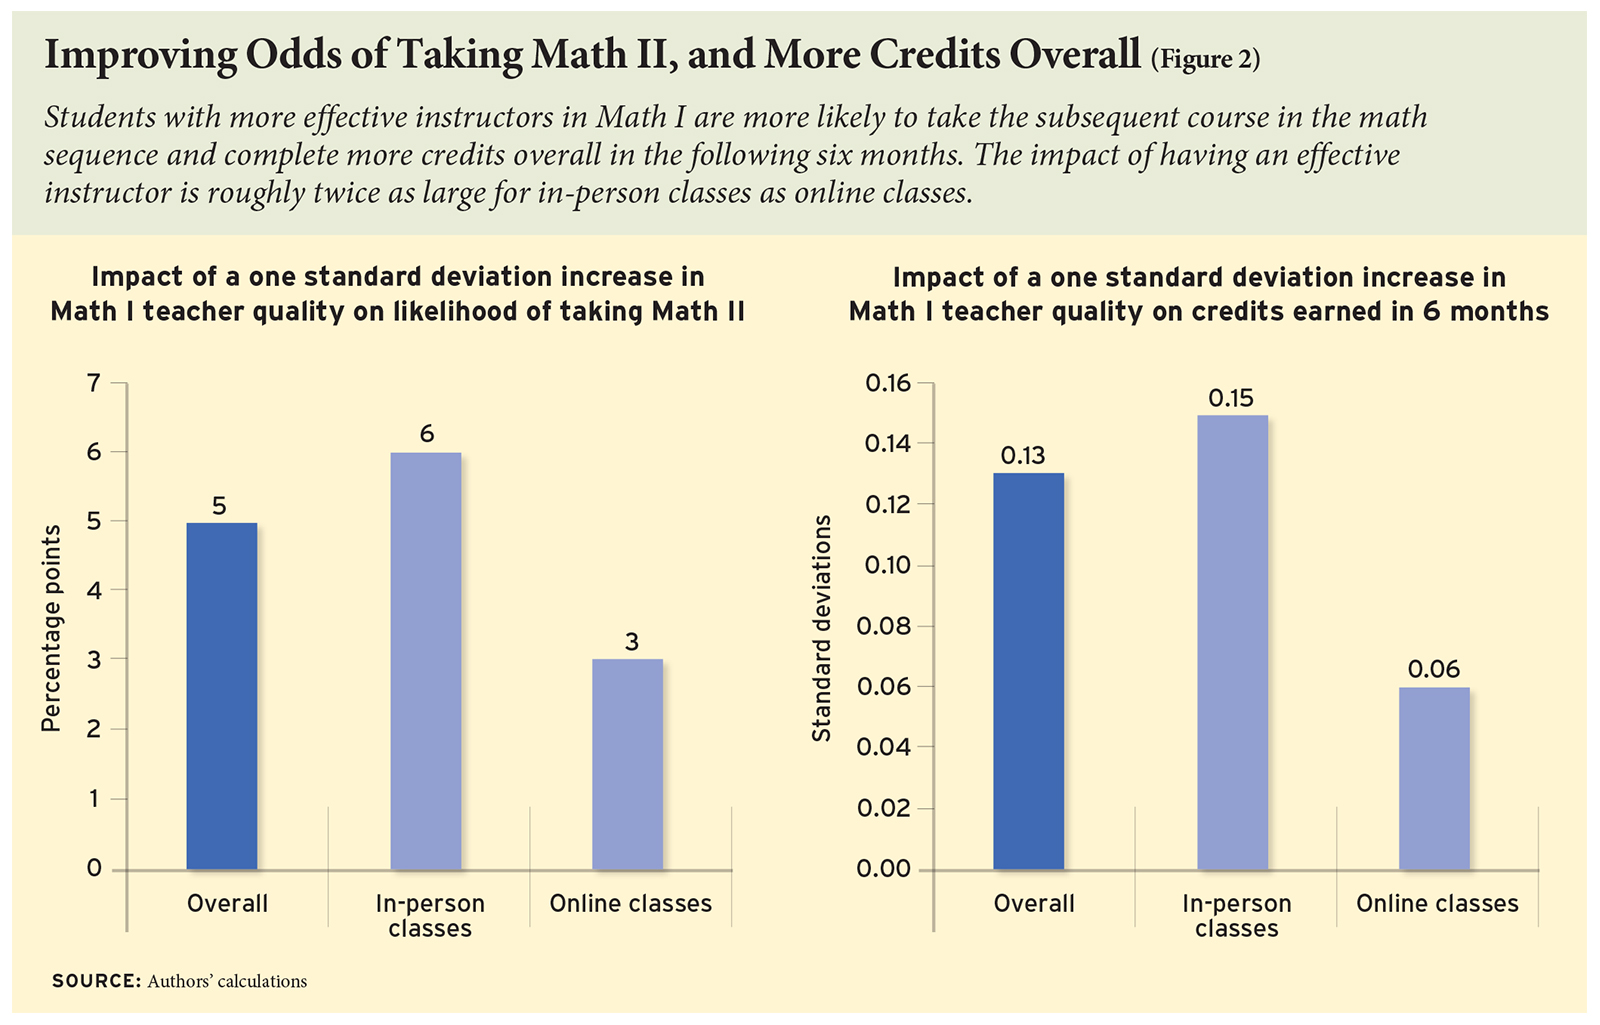
Finally, we examine instructor effects on measures of longer-term success at UPX, including students’ likelihood of taking Math II and the number of credits earned in the six months following Math I (see Figure 2). Students with more-effective instructors are more likely to continue their studies: we find an increase of 1 standard deviation in instructor quality in Math I is associated with an increase of 5 percentage points in the likelihood that students progress to Math II. The variability is twice as large for in-person sections as it is for online ones. An increase of 1 standard deviation in instructor quality is associated with an increase of 0.13 standard deviations in the number of credits earned in the six months after Math I. Similarly, we find twice as much variability for in-person instructors as for online instructors.
Does Better Teaching Mean Better Evaluations and Pay?
Although course grades and final exam performance provide two objective measures of student learning that can be used to assess instructor quality, end-of-course evaluations by students are the primary mechanism for assessing instructor quality at UPX and most other institutions. Our analysis considers a rating of eight or above by students as favorable, as these scores are considered “good” by the UPX administration.
We find substantial variability in student evaluation ratings across all instructors in our study, with one standard deviation of student-assessed effectiveness corresponding to a difference of 22 percentage points in the fraction of evaluations that are positive (higher than 8 on a 10-point scale). However, student evaluations of their instructor’s performance are most positively correlated with their grades in that class, suggesting that instructors may be rewarded through higher evaluations for high course grades. Correlations with subsequent course performance are much weaker. Collectively, this suggests that end-of-course evaluations by students are unlikely to capture much of the variation in instructor quality, especially for more distant or objective outcomes.
We also consider how instructors’ experience and pay correlates with their effectiveness. Are more-experienced instructors more effective? Are more-effective instructors paid more? For this analysis, we focus on the 18,409 sections taught by instructors hired since 2002 so that we can examine data on their full teaching history.
We find that experience matters somewhat, but that the pattern differs markedly across outcomes. Teaching Math I at least once before is associated with an increase in instructional effectiveness of 0.03 standard deviations, measured by students’ grades. However, teaching the class more than once in the past has very little additional impact. Experience has no impact on student performance in subsequent courses. And an instructor’s general experience teaching other subjects has little association with effectiveness in Math I. Consistent with the flat salary schedule, instructor salary is unrelated to measured effectiveness, varying only modestly with tenure.
Implications
We find that college instructors vary widely in their contributions to student performance—some consistently help their students succeed more than others do. And a skillful instructor provides benefits to students that last beyond a single class: those students are more likely to succeed in subsequent courses, earn more credits, and thus be better positioned to complete their degrees. Yet colleges largely ignore these important differences in performance, and instead rely on subjective measures like students’ end-of-course evaluations, which fail to truly differentiate between effective and ineffective instructors. In addition, instructor compensation is not linked to classroom performance in any direct way but rather is tied primarily to tenure and experience.
Although our analysis is based on a single university and enabled by its nontraditional format, we believe it could have broad applicability among other institutions of higher education. Our findings imply that personnel decisions and policies that attract, develop, allocate, motivate, and retain effective faculty are a potentially important tool for improving student success and institutional productivity. While these factors may not generalize to all sectors of higher education, they could be relevant at for-profit colleges, as well as at less-selective four-year and two-year schools, such as community colleges. In these institutions, which are focused on teaching rather than research, personnel policies that focus on meaningful differences in effectiveness among instructors could theoretically be adopted, to the benefit of students.
The for-profit sector, in particular, may be ripe for innovation. For-profit institutions like UPX have come under greater scrutiny over the last decade, and several high-profile closures have made improving student outcomes a first-order concern. New regulations and mandated transparency measures have come online, such as Gainful Employment and the College Scorecard.
While our study does not directly speak to the specific strategies that institutions should use to identify and improve instructor effectiveness, it does indicate the potential of such practices. For-profit institutions like UPX and other nonselective institutions, or any institution looking to improve graduation rates, should consider the important variations in performance among their instructors. By putting more effective instructors at the front of the class, they can improve the outcomes of college students—particularly those least likely to succeed.
Pieter De Vlieger is a graduate research assistant at the University of Michigan. Brian A. Jacob is co-director of the Education Policy Initiative (EPI) at the University of Michigan, where he is a professor of education policy, economics, and education. Kevin Stange is assistant professor of public policy at the University of Michigan.
This article appeared in the Summer 2017 issue of Education Next. Suggested citation format:
De Vlieger, P., Jacob, B.A., and Stange, K. (2017). Measuring Up: Assessing instructor effectiveness in higher education. Education Next, 17(3), 68-74.