Executive Summary
The federal Every Student Succeeds Act (ESSA), like No Child Left Behind before it, requires states to report information on the academic achievement of students in each of their schools, both overall and for various subgroups of students. A subgroup of particular interest to policymakers and researchers is economically disadvantaged students, who, on average, score much lower on standardized tests than their higher-income peers.

Economically disadvantaged students have historically been identified as those that participate in the National School Lunch Program, which provides free and reduced-price lunches (FRL) to students from low-income families, defined as those earning below 185 percent of the federal poverty line (currently $44,863 for a family of four).
The use of FRL for policy and research purposes is quickly unraveling, due in large part to policy changes enacted by Congress in 2010 that expand “community eligibility,” which allows schools with at least 40 percent of students identified as eligible for FRL to provide free lunches to all of their students and eliminate paper applications going forward. As a result, many schools will be unable to report student achievement for their FRL students.
Successful ESSA implementation will require the federal government to take the lead, through guidance and regulations, in suggesting feasible and uniform ways for schools and districts to meet their obligation to report the test performance of their economically disadvantaged students. New measures could include existing data on participation in means-tested programs, such as food stamps and Medicaid, or direct measures of socioeconomic status collected by states through new links between administrative data systems.
A failure to quickly identify and implement new measures of family background will render policymakers and researchers unable answer important questions and comply with federal education law.
An overarching goal of many education research and policy efforts is to improve the academic and life outcomes of children from disadvantaged backgrounds, who, on average, score much lower on standardized tests than their higher-income peers. [i] But changes in the federal free lunch program have made it more challenging than ever to accurately track the performance of students by socioeconomic background.
The policy goal of the National School Lunch Program is to feed disadvantaged children, but for many years it has also doubled as a way for researchers and policymakers to identify students from low-income families. This is because eligibility for a free or reduced-price lunch (FRL) is generally limited to children from families making less than 185 percent of the federal poverty level (the cutoff for a free lunch is 130 percent). The FRL income cutoff for a family of four is currently $44,863. [ii]
The federal Every Student Succeeds Act, like No Child Left Behind before it, requires states to hold schools accountable for the performance of their economically disadvantaged students, which is usually defined as those that receive a FRL. [iii] Researchers use FRL participation for many purposes, ranging from documenting income-based gaps in student outcomes to calculating measures of school and teacher quality that account for student characteristics.
FRL participation has always been a crude proxy for family income for a number of reasons. Despite sometimes being called FRL eligibility, it does not capture eligible families that do not participate. As a result, two schools could serve similar populations of families in terms of income but have different FRL rates because one makes greater efforts to sign up eligible families. Additionally, FRL is a very coarse measure in that students in each of three categories (free, reduced, and non-participating) can vary widely in terms of their parents’ incomes. [iv]
These problems have recently been compounded by two major changes enacted in 2010 aimed at increasing access to the program. [v] First, Congress expanded “direct certification,” under which students are deemed FRL eligible because they receive other forms of public support, such as food stamps. Second, Congress expanded “community eligibility,” which allows schools with at least 40 percent of students identified as eligible for FRL through direct-certification-type means to provide free lunches to all of their students and eliminate paper applications going forward.
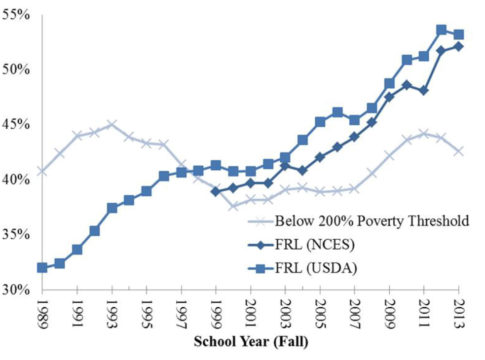
These changes are undeniably good for expanding kids’ access to free school lunches. But they may mark the beginning of the end of FRL’s moonlighting for researchers and policymakers as a socioeconomic indicator. Figure 1 shows how FRL participation rates (measured with data from two separate government agencies) have diverged from Census data on the percentage of children living in families below 200 percent of the poverty threshold (chosen because it is similar to the 185 percent FRL cutoff). [vi]
Actual poverty measures fall and rise with the state of the economy, but FRL participation has increased almost every year for more than 30 years. This is particularly noticeable in recent years, when the poverty-based measure fell but FRL participation continued to rise as the 2010 changes were implemented. The most recent data indicate that there are substantially more kids eligible for a program limited to 185 percent of the poverty line than there are kids who live in families below 200 percent of the poverty threshold—a difference that likely results in large part from the program’s community eligibility provisions.

Click to enlarge
These data make clear that FRL is not a reliable way to track the socioeconomic makeup of the U.S. student population over time. When the national FRL rate crossed the 50 percent mark for the first time in 2012-13, it generated misleading headlines such as “Majority of U.S. public school students are in poverty.” [vii] Figure 1 and other data clearly show that the share of children living in families below 50 percent, 100 percent, or 200 percent of the federal poverty threshold is similar to what it was in the early 1990s. [viii]
The full impact of the 2010 community eligibility change may still lie ahead. The most recent data (from 2015-16) indicate that about half of eligible schools have adopted community eligibility.[ix] However, it is unclear how many schools will ultimately opt into community eligibility given that they are not necessarily reimbursed for the full cost. [x]
What does this state of affairs mean for researchers and policymakers? In schools that do not participate in community eligibility, participation will continue to be an imperfect but useful proxy for children’s family incomes. Accuracy might even improve due to direct certification of students who are eligible but did not previously apply. But schools that choose the community eligibility option will all look the same in the FRL data, and students within these schools may not be differentiated based on economic disadvantage.
For researchers and policy analysts, this means that FRL should not be used to construct indicators such as achievement gaps by income over time because of changes in the composition of the FRL and non-FRL populations and the increasing amount of effectively missing data. For example, the federal government should end its practice of reporting score trends on the National Assessment of Educational Progress (NAEP) broken down by FRL participation. [xi]
For policymakers, widespread adoption of community eligibility would mean the demise of FRL as a meaningful measure in many schools (more than 18,000 schools participated in 2015-16). [xii] The most recent federal guidance permits states to exempt community eligibility schools from reporting separate data on their disadvantaged students, because they no longer collect FRL eligibility data. [xiii] This runs counter to the spirit of federal education laws aimed at shining a bright light on the academic performance of disadvantaged students.
The federal government has a responsibility to take the lead, through guidance and regulations, in suggesting feasible and uniform ways for schools and districts to meet their obligation to report the test performance of their economically disadvantaged students. One set of possible measures include participation in means-tested programs such as welfare, food stamps, and programs for homeless and foster youth. These data are already being used by many school systems for FRL direct certification, and are obtained through links to administrative databases.
More direct measures of socioeconomic status could also be collected by states through their longitudinal data systems. Family incomes could be obtained from state administrative records, such as unemployment insurance systems. More ambitiously, Congress could authorize the Internal Revenue Service to work with states to link their student-level data to family income data that would identify disadvantaged students, but be sufficiently coarse to protect privacy.
FRL participation data have long been put to research and policy uses for which they are ill-suited. But FRL status is now headed toward its demise as a useful tool for research and policy. Policymakers and researchers need to move quickly to identify new measures of family background or they will soon find themselves unable to answer important questions and comply with federal education laws.
Note: I thank Erik Rodriguez for excellent research assistance.
—Matthew M. Chingos
This post originally appeared as part of the Evidence Speaks series at Brookings.
Notes: [i] http://cepa.stanford.edu/content/widening-academic-achievement-gap-between-rich-and-poor-new-evidence-and-possible [ii] https://www.gpo.gov/fdsys/pkg/FR-2015-03-31/pdf/2015-07358.pdf [iii] http://www.edweek.org/ew/issues/every-student-succeeds-act/ [iv] Additionally, there is evidence that older students are less likely to participate, perhaps due to social stigma (http://www.ers.usda.gov/media/205594/err61_1_.pdf). [v] https://www.whitehouse.gov/sites/default/files/Child_Nutrition_Fact_Sheet_12_10_10.pdf [vi] The federal poverty line and threshold are not exactly the same, but the difference is small (https://aspe.hhs.gov/2013-poverty-guidelines). [vii] https://www.washingtonpost.com/local/education/majority-of-us-public-school-students-are-in-poverty/2015/01/15/df7171d0-9ce9-11e4-a7ee-526210d665b4_story.html [viii] http://www.childstats.gov/americaschildren/tables/econ1b.asp [ix] http://frac.org/pdf/take-up-of-cep-report.pdf [x] http://www.fns.usda.gov/cep-planning-and-implementation-guidance [xi] http://www.nationsreportcard.gov/reading_math_2015/#mathematics/groups?grade=4 [xii] http://frac.org/pdf/take-up-of-cep-report.pdf [xiii] http://www.fns.usda.gov/sites/default/files/cn/SP35-2015av2.pdf