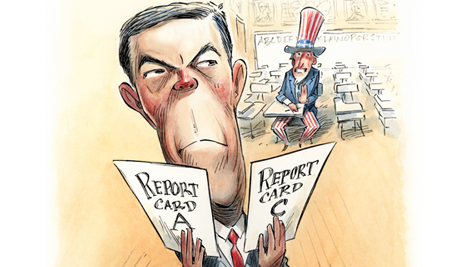
Caught between extraordinary public expectations and relatively modest constitutional authority, U.S. presidents historically have fashioned all sorts of mechanisms—executive orders, proclamations, memoranda—by which to move their objectives forward. Under President Barack Obama’s administration, presidential entrepreneurialism has continued unabated. Like his predecessors, Obama has sought to harness and consolidate his influence outside of Congress. He also has made contributions of his own to the arsenal of administrative policy devices. The most creative, perhaps, is his Race to the Top initiative, which attempted to spur wide-ranging reforms in education, a policy domain in which past presidents exercised very little independent authority.
 This study examines the effects of Obama’s Race to the Top on education policymaking around the country. In doing so, it does not assess the efficacy of the particular policies promoted by the initiative, nor does it investigate how Race to the Top altered practices within schools or districts. Rather, the focus is the education policymaking process itself; the adoption of education policies is the outcome of interest.
No single test provides incontrovertible evidence about its causal effects. The overall findings, however, indicate that Race to the Top had a meaningful impact on the production of education policy across the United States. In its aftermath, all states experienced a marked surge in the adoption of education policies. This surge does not appear to be a statistical aberration or an extension of past policy trends. Legislators from all states reported that Race to the Top affected policy deliberations within their states. The patterns of policy adoptions and legislator responses, moreover, correspond with states’ experiences in the Race to the Top competitions.
In the main, the evidence suggests that by strategically deploying funds to cash-strapped states and massively increasing the public profile of a controversial set of education policies, the president managed to stimulate reforms that had stalled in state legislatures, stood no chance of enactment in Congress, and could not be accomplished via unilateral action.
Asking States to Compete
On February 17, 2009, President Obama signed into law the American Recovery and Reinvestment Act of 2009 (ARRA), legislation that was designed to stimulate the economy; support job creation; and invest in critical sectors, including education, in the aftermath of the Great Recession. Roughly $100 billion of the ARRA was allocated for education, with $4.35 billion set aside for the establishment of Race to the Top, a competitive grant program designed to encourage states to support education innovation.
From the outset, the president saw Race to the Top as a way to induce state-level policymaking that aligned with his education objectives on college readiness, the creation of new data systems, teacher effectiveness, and persistently low-performing schools. As he noted in his July 2009 speech announcing the initiative, Obama intended to “incentivize excellence and spur reform and launch a race to the top in America’s public schools.”
The U.S. Department of Education (ED) exercised considerable discretion over the design and operation of the Race to the Top competition. Within a handful of broad priorities identified by Congress in ARRA, the Obama administration chose which specific policies would be rewarded, and by how much; how many states would receive financial rewards, and in what amount; and what kinds of oversight mechanisms would be used to ensure compliance. Subsequent to the ARRA’s enactment, Congress did not issue any binding requirements for the design or administration of the program. From an operational standpoint, Race to the Top was nearly entirely the handiwork of ED.
Race to the Top comprised three distinct phases of competition. Both Phase 1 and Phase 2 included specific education-policy priorities on which each applicant would be evaluated. States were asked to describe their current status and outline their future goals in meeting the criteria in each of these categories. The education policy priorities spanned six major scoring categories and one competitive preference category (see Table 1).

To assist states in writing their applications, ED offered technical assistance workshops, webinars, and training materials. Additionally, nonprofit organizations such as the National Council on Teacher Quality published reports intended to help states maximize their likelihood of winning an award. Nonetheless, substantial uncertainty shrouded some components of the competition, including the exact grading procedures, number of possible winners, total allocated prize amount per winning state, and prize allocation mechanism and timeline.
 When all was said and done, 40 states and the District of Columbia submitted applications to Phase 1 of the competition. Finalists and winners were announced in March 2010. Phase 1 winners Tennessee and Delaware were awarded roughly $500 million and $120 million, respectively, which amounted to 10 percent and 5.7 percent of the two respective states’ budgets for K‒12 education for a single year. Figure 1 identifies all winners and award amounts.
Thirty-five states and the District of Columbia submitted applications to Phase 2 of the competition in June 2010. Ten winners were each awarded prizes between $75 million and $700 million in Phase 2.
Having exhausted the ARRA funds, the president in 2011 sought additional support for the competition. That spring, Congress allotted funds to support a third phase, in which only losing finalists from Phase 2 could participate. A significantly higher percentage of participating states won in Phase 3, although the amounts of these grants were considerably smaller than those from Phases 1 and 2. On December 23, 2011, ED announced Phase 3 winners, which received prizes ranging from $17 million to $43 million.
States that won Race to the Top grants were subject to a nontrivial monitoring process, complete with annual performance reports, accountability protocols, and site visits. After receiving an award letter, a state could immediately withdraw up to 12.5 percent of its overall award. The remaining balance of funds, however, was available to winning states only after ED received and approved a final scope of work from the state’s participating local education agencies. Each winning state’s drawdown of funds, then, depended upon its ability to meet the specific goals and timelines outlined in its scope of work.
Impact on State Policy
In its public rhetoric, the Obama administration emphasized its intention to use Race to the Top to stimulate new education-policy activity. How would we know if it succeeded? To identify the effects of Race to the Top on state-level policymaking, ideally one would take advantage of plausibly random variation in either eligibility or participation. Unfortunately, neither of these strategies is possible, as all states were allowed to enter the competition and participation was entirely voluntary. To discern Race to the Top’s policy consequences, therefore, I exploit other kinds of comparisons between policy changes in the 19 winning states and the District of Columbia, the 28 losers, and the 4 that did not participate; commitments that different states made in their applications and subsequent policymaking activities; and changes in policymaking at different intervals of the competitions.
Policy Adoptions. Perhaps the most telling piece of evidence related to the effect of Race to the Top is the number of relevant education reforms adopted as state policy in the aftermath of the competition’s announcement. To determine that number, my research team and I documented trends in actual policy enactments across the 50 states and the District of Columbia. We tracked numerous policies that clearly fit the various criteria laid out under Race to the Top, and covered such topics as charter schools, data management, intervention into low-performing schools, and the use of test scores for school personnel policy, as well as three additional control policies—increased high-school graduation requirements, the establishment of 3rd-grade test-based promotion policies, and tax credits to support private-school scholarships—that were similar to Race to the Top policies but were neither mentioned nor rewarded under the program (see sidebar, opposite page, for specific policies tracked for Race to the Top applications and state adoptions).
Across all 50 states and the District of Columbia, we examined whether a state legislature, governor, school board, professional standards board, or any other governing body with statewide authority had enacted a qualifying policy each year between 2001 and 2014. Policies that were merely proposed or out for comment did not qualify. We also examined whether each state in its written application claimed to have already enacted each policy or expressed its clear intention to do so, as well as the number of points the application received in the scoring process.

These data reveal that the Race to the Top competitions did not reward states exclusively on the basis of what they had already done. Race to the Top, in this sense, did not function as an award ceremony for states’ past accomplishments. Rather, both states’ past accomplishments and their stated commitments to adopt new policies informed the scores they received—and hence their chances of winning federal funding.
We also found that states around the country enacted a subset of these reform policies at a much higher rate in the aftermath of Race to the Top than previously. Between 2001 and 2008, states on average enacted about 10 percent of reform policies. Between 2009 and 2014, however, they had enacted 68 percent. And during this later period, adoption rates increased every single year. At the rate established by preexisting trends, it would have taken states multiple decades to accomplish what, in the aftermath of the competitions, was accomplished in less than five years.
Policy Adoptions in Winning, Losing, and Nonapplying States. The surge of legislative activity was not limited to states that were awarded Race to the Top funding. Figure 2 illustrates the policy adoption activity of three groups of states: those that won in one of the three phases of competition; those that applied in at least one phase but never won; and those that never applied. In nearly every year between 2001 and 2008, policy adoption rates in these groups were both low and essentially indistinguishable from one another. In the aftermath of Race to the Top’s announcement, however, adoption rates for all three groups increased dramatically. By 2014, winning states had adopted, on average, 88 percent of the policies, compared to 68 percent among losing states, and 56 percent among states that never applied.

Regression analyses that account for previous policy adoptions and other state characteristics show that winning states were 37 percentage points more likely to have enacted a Race to the Top policy after the competitions than nonapplicant states. While losing states were also more likely than nonapplicants to have adopted such policies, the estimated effects for winning states are roughly twice as large. Anecdotal media reports, as well as interviews conducted by my research team, suggest that the process of applying to the competitions by itself generated some momentum behind policy reform. Such momentum, along with the increased attention given to Race to the Top policies, may explain why those states that did not even apply to the competition nonetheless began to enact these policies at higher rates.
Winning states were also more likely to have adopted one of the control policies, which is not altogether surprising, given the complementarities between Race to the Top policies and the chosen control policies. Still, the estimated relationship between winning and the adoption of Race to the Top policies is more than twice as large as that between winning and the adoption of control policies.
My results also suggest that both winning and losing states were especially likely to adopt policies about which they made clear commitments in their Race to the Top applications. Though the effects are not always statistically significant, winning states appear 21 percentage points more likely to adopt a policy about which they made a promise than one about which they did not; put differently, they were 36 percentage points more likely to adopt a policy about which they made an explicit commitment than were nonapplying states, which, for obvious reasons, made no promises at all. Losing states, meanwhile, were 31 percentage points more likely to adopt a policy on which they had made a promise than on a policy on which they had not.
Closer examination of winning, losing, and nonapplying states illuminates how Race to the Top influenced policymaking in all states, regardless of their status. One winning state, Illinois, submitted applications in all three phases before finally winning. Its biggest policy accomplishments, however, happened well before it received any funds from ED. The rapid enactment of Race to the Top policies in Illinois reflected a concerted effort by the state government to strengthen its application in each competition. Before the state even submitted its Phase 1 application, Illinois enacted the Performance Evaluation Reform Act (PERA), a law that significantly changed teacher and principal evaluation practices.
After losing in Phase 1, Illinois went on to adopt several other Race to the Top policies prior to submitting Phase 2 and Phase 3 applications. The competition served as a clear catalyst for education reform in the state. As Illinois state senator Kimberly Lightford noted, “It’s not that we’ve never wanted to do it before. I think Race to the Top was our driving force to get us all honest and fair, and willing to negotiate at the table.”
Whereas persistence eventually paid off for Illinois, California’s applications never resulted in Race to the Top funding. As in Illinois, lawmakers in California adopted several significant education reforms in an effort to solidify their chances of winning an award. Prior to the first-round deadline, the director of federal policy for Democrats for Education Reform noted that in California, “there’s been more state legislation [around education reform] in the last eight months than there was in the entire seven or eight years of No Child Left Behind, in terms of laws passed.”
California was not selected as a Phase 1 or Phase 2 winner, and a change in the governor’s mansion prior to Phase 3 meant the state would not compete in the last competition. While the state never did receive any funding, California did not revoke any of the policies it had enacted during its failed bids.

What about the four states that never applied for Race to the Top funding? By jump-starting education policy reform in some states, the competition may have influenced policy deliberations in others. Alaska provides a case in point. When Race to the Top was first announced, Alaska’s education commissioner, Larry LeDoux, cited concerns about federal government power and the program’s urban focus as reasons not to apply.
Still, in the years that followed, Alaska adopted a batch of policies that either perfectly or nearly perfectly aligned with Race to the Top priorities. One of the most consequential concerned the state’s teacher-evaluation system. In 2012, the Alaska Department of Education approved changes that required that 20 percent of a teacher’s assessment be based on data from at least one standardized test, a percentage that would increase to 50 by the 2018‒19 school year. In defending the rule, Governor Sean Parnell recognized the importance of keeping pace with other states’ policy achievements: “Nearly 20 states in the nation now weight at least 33 percent, and many 50 percent, of the performance evaluation based on student academic progress. I would like Alaska to lead in this, not bring up the rear with 20 percent of an evaluation focused on student improvement.” Those 20 states that had made the changes, it bears emphasizing, had participated in Race to the Top.

Policymaker Perspectives. To further assess the influence of Race to the Top on state policymaking, I consulted state legislators. Embedded in a nationally representative survey of state legislators conducted in the spring of 2014 was a question about the importance of Race to the Top for the education policy deliberations within their states. Roughly one-third of legislators reported that Race to the Top had either a “massive” or “big” impact on education policymaking in their state. Another 49 percent reported that it had a “minor” impact, whereas just 19 percent claimed that it had no impact at all.
Lawmakers’ responses mirror my finding that Race to the Top influenced policymaking in all states, with the greatest impact on winning states. Winners were fully 36 percentage points more likely to say that Race to the Top had a massive or big impact than losers, who, in turn, were 12 percentage points more likely than legislators in states that never applied to say as much. If these reports are to be believed, Race to the Top did not merely reward winning states for their independent policy achievements. Rather, the competitions meaningfully influenced education policymaking within their states.
Even legislators from nonapplying states recognized the relevance of Race to the Top for their education policymaking deliberations. Indeed, a majority of legislators from states that never applied nonetheless reported that the competitions had some influence over policymaking within their states. Although dosages vary, all states appear to have been “treated” by the Race to the Top policy intervention.
From Policy to Practice. None of the preceding analyses speak to the translation of policy enactments into real-world outcomes. For all sorts of reasons, the possibility that Race to the Top influenced the production of education policy around the country does not mean that it changed goings-on within schools and districts.
Still, preliminary evidence suggests that Race to the Top can count more than just policy enactments on its list of accomplishments. As Education Next has reported elsewhere (see “States Raise Proficiency Standards in Math and Reading,” features, Summer 2015), states introduced more rigorous standards for student academic proficiency in the aftermath of Race to the Top. Moreover, they did so in ways that reflected their experiences in the competition itself.
 Figure 3a tracks over a 10-year period the average rigor of standards in states that eventually won Race to the Top, states that applied but never won, and states that never applied. Throughout this period, eventual winners and losers looked better than nonapplicants. Before the competition, though, winners and loser looked indistinguishable from one another. Between 2003 and 2009, the rigor of their state standards declined at nearly identical rates and to identical levels. In the aftermath of Race to the Top, however, winning states rebounded dramatically, reaching unprecedented heights within just two years. While losing states showed some improvement, the reversal was not nearly as dramatic. Nonapplying states, meanwhile, maintained their relatively low standards.
The impact of Race to the Top on charter schools, which constituted a less significant portion of the competition, is not nearly so apparent. In winning states, higher percentages of public school students attend charter schools than in either losing or non-applying states. But as Figure 3b shows, post-Race to the Top gains appear indistinguishable from the projections of previous trends. While Race to the Top may have helped sustain previous gains, it seems unlikely. Between 2003 and 2013, the three groups of states showed nearly constant gains in charter school enrollments.
Conclusions and Implications
With Race to the Top, the Obama administration sought to remake education policy around the nation. The evidence presented in this paper suggests that it met with a fair bit of success. In the aftermath, states adopted at unprecedented rates policies that were explicitly rewarded under the competitions.
States that participated in the competitions were especially likely to adopt Race to the Top policies, particularly those on which they made explicit policy commitments in their applications. These patterns of policy adoptions and endorsements, moreover, were confirmed by a nationally representative sample of state legislators who were asked to assess the impact of Race to the Top on education policymaking in their respective states.
Differences in the policy actions of winning, losing, and nonapplying states, however, do not adequately characterize the depth or breadth of the president’s influence. In the aftermath of Race to the Top, all states experienced a marked surge in the adoption of education policies. And legislators from all states reported that Race to the Top affected policy deliberations within their states.
While it is possible that Race to the Top appeared on the scene at a time when states were already poised to enact widespread policy reforms, several facts suggest that the initiative is at least partially responsible for the rising rate of policy adoption from 2009 onward. First, winning states distinguished themselves from losing and nonapplying states more by the enactment of Race to the Top policies than by other related education reforms. Second, at least in 2009 and 2010, Race to the Top did not coincide with any other major policy initiative that could plausibly explain the patterns of policy activities documented in this paper. (Obama’s selective provision of waivers to No Child Left Behind, a possible confounder, did not begin until later.) Finally, state legislators’ own testimony confirms the central role that the competitions played in the adoption of state policies between 2009 and 2014, either by directly changing the incentives of policymakers within applying states or by generating cross-state pressures in nonapplying states.
The surge of post-2009 policy activity constitutes a major accomplishment for the Obama administration. With a relatively small amount of money, little formal constitutional authority in education, and without the power to unilaterally impose his will upon state governments, President Obama managed to jump-start policy processes that had languished for years in state governments around the country. When it comes to domestic policymaking, past presidents often accomplished a lot less with a lot more.
William G. Howell is professor of American politics at the University of Chicago.
This article appeared in the Fall 2015 issue of Education Next. Suggested citation format:
Howell, W.G. (2015). Results of President Obama’s Race to the Top: Win or lose, states enacted education reforms. Education Next, 15(4), 58-66.