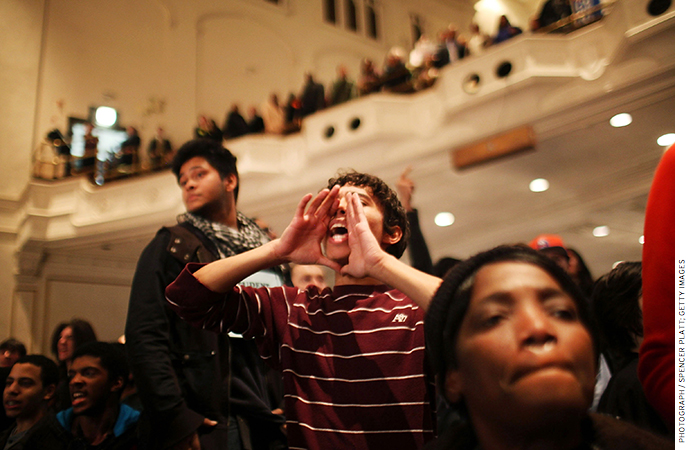
New York City’s public hearings on closing schools for poor performance often featured passionate testimony, shouting from the audience, and parents and teachers waving signs that read “Save Our Schools” and “Stop School Closures.” The educational improvement tactic of last resort almost always triggers protests—similar scenes have played out in Detroit, Chicago, and Philadelphia in recent years.
Closing schools is clearly controversial. But does it work?
We found a unique opportunity to study performance-based high-school closures in New York City, which closed 44 low-performing high schools from 2000 to 2014. The closures were part of a sweeping and interconnected set of secondary-school reforms introduced by former mayor Michael Bloomberg and chancellor Joel Klein, which also included opening more than 200 new small, themed high schools and extending high school choice to all students throughout the district. By implementing these changes together, they hoped to eliminate dropout factories, improve educational options available to students who had been historically assigned to failing schools by virtue of where they lived, and raise graduation rates. After they were slated for closure, high schools would stop accepting new students and gradually phase out as students transferred elsewhere, graduated, or dropped out over the next three years.
During the next decade, graduation rates in New York City rose dramatically. Between 2003 and 2011, for example, on-time graduation rates increased from 51 percent to 69 percent, and college enrollment rates kept pace with the increasing number of high school graduates. Still, closure decisions remained unpopular. Parents and teachers complained about instability and the loss of neighborhood institutions. Lawsuits filed by the United Federation of Teachers and the NAACP alleged that the closures were carelessly orchestrated and would do students harm. Critics claimed that Bloomberg and Klein were primarily interested in weakening teachers unions, not improving student achievement.
Much has been written about the controversy surrounding performance-based school closures, but there has been no rigorous assessment of their impact on student achievement. Does the closure process harm students who are enrolled in a school while it is being phased out? Are future students better-off because a low-performing option has been eliminated?
To explore these questions, we studied the 29 high school closures begun between 2003 and 2009 in New York City to determine the degree to which a closure affected a range of student outcomes, including graduation rates, mobility, attendance, and academic performance. We analyzed outcomes for 20,600 affected students: 9th-grade students who chose to stay after a closure announcement, 9th graders who transferred elsewhere, and rising 9th graders required to attend different high schools because of a closure.
We found that for students already enrolled in a school that was later closed, the phase-out process did not have a systematic impact, positive or negative, on their attendance or academic performance. This held true whether they remained at the school throughout the phase-out process or transferred to another high school. However, we found that for rising 9th-grade students, the closure of their most likely high-school option led them to enroll in somewhat higher-performing high schools and substantially improved their likelihood of graduating with a New York State Regents diploma.
While our analysis provides the most reliable evidence to date on the overall impact of the closure process on student outcomes, we cannot identify the precise mechanisms that explain closures’ impact or lack thereof. More research is needed to understand how school closures affect factors like teacher performance, student and staff morale, and family engagement over time. Our findings, however, suggest that high school closures in New York City during this particular period produced meaningful benefits for future students while not harming, at least academically, the students most immediately affected by them.
Which Schools Were Shut?
Before analyzing whether school closures had a positive effect on student outcomes, we first wanted to know: Were the high schools designated for closure really the lowest-performing high schools in New York City? The official criteria for performance-based closures were fluid, and officials from the New York City Department of Education faced criticism that closure decisions were opaque and unregulated.
To answer this question, we analyzed ten indicators of student performance at the 322 New York City schools that enrolled 9th-grade students for at least four years between 1999 and 2008. The ten indicators were: 9th-grade attendance rates; rates of college readiness at the end of each grade (as measured by the number of students on track to earn a Regents diploma as opposed to a less-rigorous “local” diploma); the number of credits earned and Regents exams passed by grade 12; dropout and transfer rates; graduation rates; and rates of receiving a Regents diploma. Then, we averaged data over the two- to four-year period prior to closure announcements and created a performance index that ranked schools.
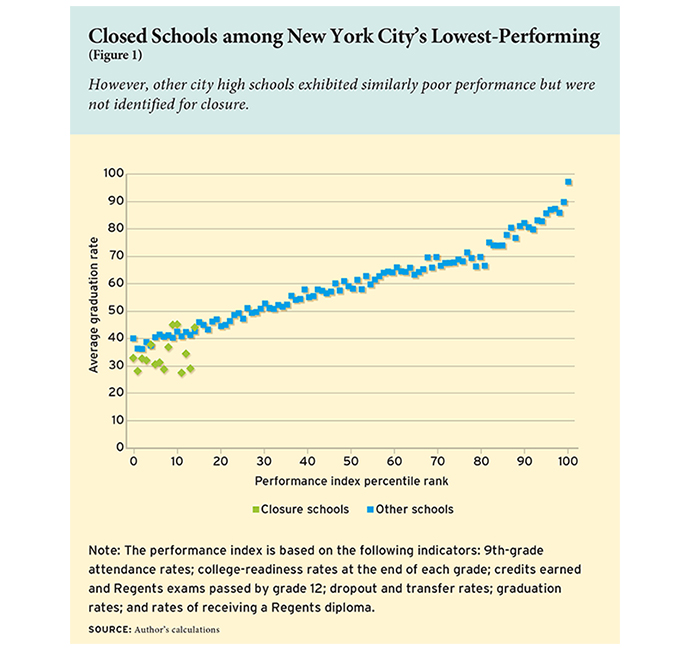
We found that the 29 schools designated for closure were consistently among the lowest-performing high schools in New York City during the years studied (Figure 1). None of these schools were ranked above the 20th percentile in the district at the time of the closure decision, and a majority were ranked in the bottom 5 percent. All of them were ranked in the bottom 5 percent during at least one of the four years leading up to the closure decision. They posted especially poor graduation rates: less than 40 percent of students at closure schools graduated within four years, compared to citywide averages of about 60 percent during those years.
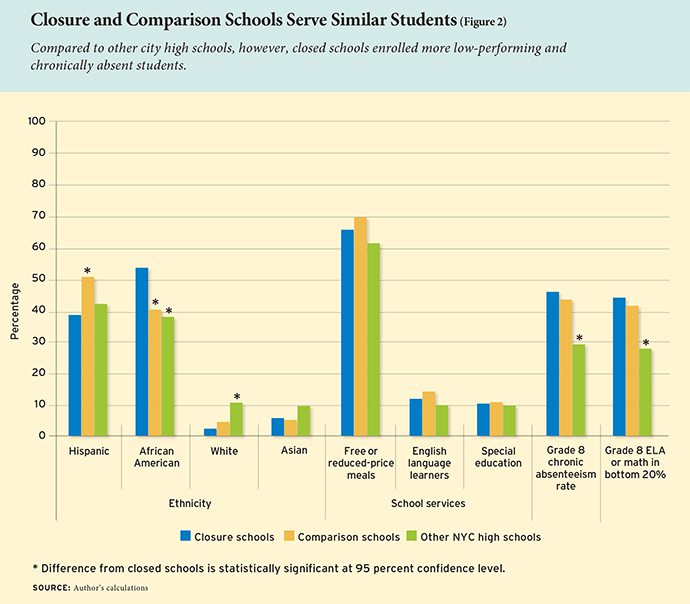
We also analyzed the demographic and performance characteristics of incoming 9th-grade students during those years at all 322 schools. Notably, we found that the schools identified for closure served similar proportions of low-income and special-needs students compared to other high schools across the city (Figure 2). However, based on students’ 8th-grade test scores and attendance rates, they enrolled higher concentrations of low-performing and chronically absent students. The closure schools also had a much higher concentration of students who were older than the typical student for their grade (indicating that they may have been retained in a prior grade).
In light of these differences, it is possible that the poor outcomes at closure schools reflected students’ incoming readiness rather than the schools’ effectiveness at ensuring student success. To test this, we made a second set of comparisons that adjust for differences in the background characteristics and prior performance of incoming students. We found that about half of the difference in student outcomes in schools slated for closure and the broader sample of schools can be explained by differences in incoming students’ demographic characteristics, absenteeism, and achievement in middle school. Therefore, substantial performance gaps remain between the groups of schools, even after accounting for the differences in the students they served, suggesting that struggling students were less likely to succeed in the closure schools than they were in other schools throughout the city.
The evidence indicates that the schools slated for closure in New York City were failing many of their students. However, our analysis also revealed a group of other high schools that exhibited similarly poor performance and enrolled similarly low-achieving students—but were not selected for closure. In each year we studied, we found between 10 and 29 schools where performance was at or below those identified for closure. All of these schools were ranked in the bottom 10 percent of schools, and all but eight were ranked in the bottom 5 percent. It is unclear why they were not closed.
These schools—similar to the closure schools except that they were not scheduled for closure—serve as a comparison group for the analyses that follow.
The Phase-Out Process
New York City opted to close schools through a “phase-out” process rather than shut the doors and send students elsewhere all at once. After a school was slated for closure, it stopped admitting new 9th-grade students. Students already enrolled were allowed to transfer to another high school of their choice, or to continue attending the closure school until the year of their expected graduation. The closure school slowly shrank as students left or graduated over the next few years.
Critics deemed this phase-out process cruel. Students were described in the press as casualties who bore the brunt of persistent school failure and then had their lives upended when officials decided to intervene. The New York Times described it as “purgatory,” with “elective classes and after-school programs falling away” and “favorite teachers seeking new jobs.”
On the other hand, some closure advocates predicted that students would benefit during the phase-out process. Since each school’s enrollment declined as students transferred, graduated, or dropped out, students who chose to stay as their school phased out could potentially receive increased personal attention and resources from the administration and faculty. Alternatively, students who chose to leave could transfer to other, potentially better high schools, an option that was not typically offered to New York City students after 9th grade.
To determine which hypothesis was more accurate, we assessed the net impact of the phase-out process on a range of outcomes for the 9,600 9th-grade students who were beginning their high school careers at a closure school just as that closure was announced. This group, which we call the “phase-out cohort,” had the maximum exposure to the phase-out process. The outcomes we analyzed included: attendance, chronic absenteeism, mobility, graduation rates, diploma type, and credits earned.
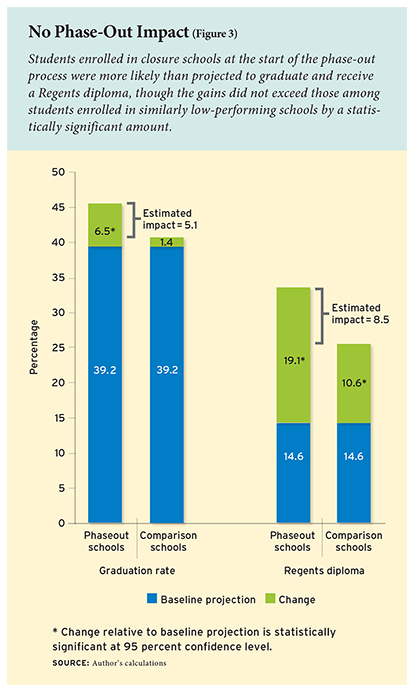 In order to assess the impact of a closure decision on graduation rates, we first predicted rates for the phase-out cohort if their school had not been slated for closure, based on their characteristics and the prior trend in performance at their school. We then compared students’ actual graduation rates with the prediction, to see if they did better or worse than expected. We found that more students in the phase-out cohort graduated high school than expected. There was an improvement in the graduation rate of 6.5 percentage points (Figure 3).
However, the improved graduation rate was not necessarily caused by the phase-out process itself. New York City was in the midst of many school-improvement efforts during the years studied, including new accountability rules and interventions at low-performing schools citywide. It is possible that the improvement in graduation rates was not unique to the phase-out cohort but rather was an artifact of these other reforms. In order to shed light on this possibility, we also projected graduation rates for students at the comparison schools, and compared those projections with their students’ actual graduation rates.
We found that graduation rates at the comparison schools were improving more quickly than those at the closure schools in the years leading up to closure decisions. In addition, students’ actual graduation rates were slightly higher than the projected trend: 40.6 percent, compared to the projected rate of 39.2 percent, for a difference of 1.4 percentage points.
Whereas the schools identified for closure experienced an increase of 6.5 percentage points relative to their projected graduation rate, the other low-performing comparison schools experienced an increase of 1.4 percentage points. This means that the net difference was a 5.1-percentage-point increase in graduation rates over and above the influence of other factors that were affecting low-performing schools citywide. This difference is not statistically significant at conventional levels, meaning that we cannot conclude with confidence that it is not a result of chance. That said, it is reasonable to conclude that the phase-out process did not have a negative impact on the graduation rates of students enrolled in the schools during the process—and may even have improved them.
Looking beyond graduation rates, we also found that the phase-out process did not have a clear impact—positive or negative—on other academic outcomes for the phase-out cohort, such as credits earned or Regents exams passed, or on attendance. While phase-out cohort students did better with respect to some of these outcomes than expected, based on their background characteristics and the prior performance trend at their school, students attending comparison schools also registered gains.
Mobile and Non-Mobile Students
The phase-out process did have a systematic impact on student mobility. As with graduation rates, we projected mobility rates for the phase-out cohort if their school had not been slated for closure, based on their characteristics and the prior trend at their school. We then compared students’ actual mobility rates with the prediction. We found that more students in the phase-out cohort left their school before 12th grade, with the percentage of students still in their 9th-grade school at the end of 12th grade dropping by 6.9 percentage points to 48.8 percent, from 41.9 percent. Of course, because students in the phase-out schools were given the option of transferring, it is not surprising that they were more likely to change schools.
At the same time, however, students in the comparison schools were somewhat more likely to stay in their 9th-grade school through the end of 12th grade: we found an increase of 2.6 percentage points, to 44.5 percent from 41.9 percent. By comparing the changes at the two groups of schools, we found a net difference of 9.5 percentage points.
Were students better-off if they remained in the closure schools, or did they do better if they transferred? To explore this question, we conducted two sets of analyses.
First, we examined outcomes for students who remained in their 9th-grade school through the end of their scheduled 12th-grade year, or until they dropped out or graduated. As with the core impact analysis, we compared outcomes before and after the closure decision for both the closing schools and comparison schools, to shed light on the degree to which the phase-out process itself affected outcomes for non-mobile students.
We found that students who remained in the closure schools during the phase-out process were more likely to graduate high school. The graduation rate rose to 53.4 percent from the projected 42 percent, an 11.4-percentage-point increase. In addition, students were more likely to earn a Regents diploma at graduation; that rate grew to 38.2 percent from 15.1 percent, a 23.1-percentage-point increase. By contrast, the graduation rate was flat at comparison schools. The percentage of students earning Regents diplomas increased, though not as sharply as in closure schools, to 30 percent from 15.1 percent. On most other indicators, student improvement was modest and similar to that in the comparison group, indicating that improvement cannot be ascribed to the closure process.
The second strand of analysis focused on students who transferred from their 9th-grade schools to another New York City high school before the end of their 12th-grade year, or before they dropped out or graduated. Among those students, we found no evidence of a systematic net impact (positive or negative) on outcomes. Students who transferred from closure schools showed modest improvements in some outcomes relative to their school’s projected performance based on past trends. Transfer students from the comparison schools also showed improvement over projected performance. Overall, none of the estimated net differences were statistically significant.
After the High Schools Close
What about students who would have been assigned to one of the closure schools but matriculated to high school after the phase-out process began? To answer this question, we identified a cohort of approximately 11,000 8th-grade students who lived in neighborhoods or attended middle schools that fed into the closure schools, and who had background characteristics similar to students who had previously enrolled at the closure schools. These students were compelled to attend a different high school than the one they would have otherwise attended; we refer to them as the “post-closure cohort.” New York City’s open choice system provided them with access to schools throughout the city, which often included one or more new small, themed high schools, including those that opened in the same building as the larger school that had been closed.
 There are at least three plausible hypotheses about a closure’s potential impact on outcomes for these students: that they would do better, because a closure eliminates their weakest educational option; that their outcomes would be the same, because they would likely transfer to a similarly low-performing school nearby; or that their outcomes would be the same or worse, because even if they transferred to higher-performing schools, the schools may not be well-suited to meet their needs.
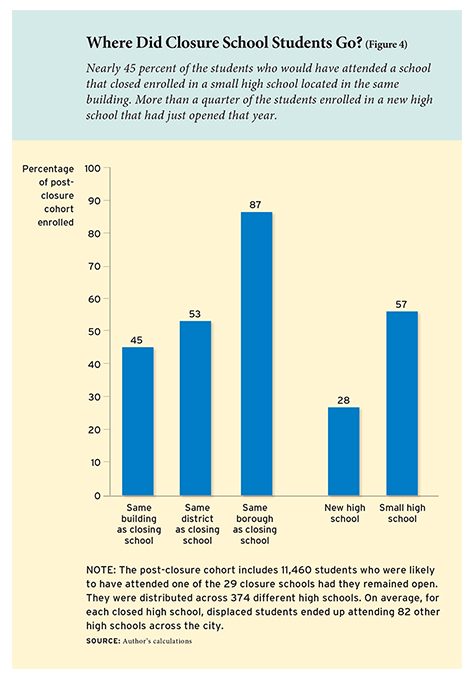
The post-closure students we identified for this aspect of the study dispersed widely (Figure 4). In all, the 11,000 students in the post-closure cohorts were distributed across 374 different high schools. On average, for each closed high school, displaced students ended up attending 82 other high schools across the city. However, many students stayed nearby: 87 percent attended school in the same borough, 53 percent remained in the same community school district, and 45 percent enrolled in a small high school located in the same building as their closure school. Underlining the interrelated nature of New York City’s secondary-school reforms, 57 percent of students enrolled in a small high school serving fewer than 110 students, and 28 percent enrolled in a school that had opened the year they enrolled.
By comparing schools on a variety of measures, we found that post-closure students generally enrolled in higher-performing high schools than they would have otherwise attended. At these schools, the population of entering 9th graders was less likely to be older than usual for their grade, had higher middle-school attendance rates, and had higher average 8th-grade test scores. Furthermore, they had substantially higher 9th-grade attendance rates and lower rates of chronic absenteeism. However, the two groups of schools enrolled similar percentages of students who received special-education services, were English language learners, or were eligible for free or reduced-price school meals.
In short, students from the post-closure cohorts enrolled in better-performing schools. But did they themselves do better? To answer this question, we extended our projections of a range of student outcomes at both the closure and comparison schools, to provide an estimate of what would have occurred had the schools stayed on their historical trajectories. Net differences represent the effects of a closure, showing us the impact on students who had to choose a different high school.
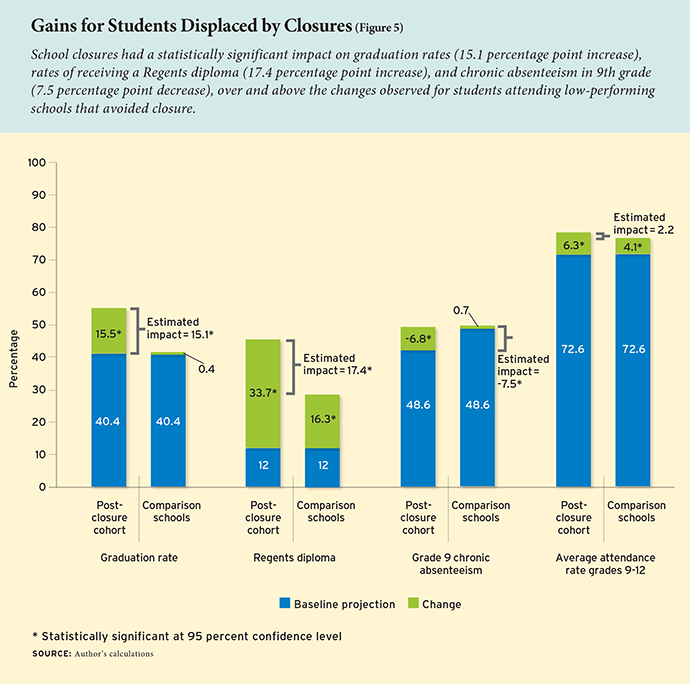
While students at both groups of schools did better than the trends projected in the years studied, closures produced positive and statistically significant impacts on several key outcomes for displaced students versus those in the comparison group (Figure 5). Most notably, closures improved graduation rates for displaced students by 15.1 percentage points—with all of that improvement coming through a 17.4-percentage-point increase in the share of students earning more rigorous Regents diplomas. The closures also produced a net improvement in 9th-grade attendance rates and credit accumulation. Taken together, this is compelling evidence that students benefited from having a low-performing option eliminated from their high-school choice set.
Policy Implications
As districts across the country continue to grapple with the persistent struggles of very low-performing high schools, it is imperative that we build better evidence about the range of options at their disposal, including performance-based closures. While these findings provide encouraging evidence about their impact on students who no longer had to attend those high schools, future debates should be sensitive to both the limitations inherent in this study and issues not yet addressed by this or other research.
Our analysis does not include impacts on teachers, administrators, the surrounding community, or other schools nearby. And while we attempted to isolate the impacts of school closures on student outcomes, it remains possible that other, unmeasured factors were also at play. In addition, this research stops short of dissecting the influence of specific features of the phase-out process on student outcomes. We cannot identify the precise mechanisms that explain closures’ impact or, in some cases, the lack thereof. Future work on closures should examine such factors as staff composition and mobility, faculty and student morale, and interpersonal relationships, to achieve a richer understanding of how closures impact school communities and student outcomes.
Finally, it is important to keep in mind that, although we found that students who likely would have attended the closed schools fared better elsewhere, they still did not fare well. On average, just 56 percent of these students graduated from high school within four years. This highlights deeply entrenched inequalities in New York City schools, where poor students of color lag far behind their more-privileged peers on a wide range of measures. Ultimately, whether or not closures are part of the policy framework in any district, there is a need to invest in vulnerable students and to identify structures and supports that maximize their odds of success.
James J. Kemple is executive director of the Research Alliance for New York City Schools and research professor at the Steinhardt School of Culture, Education, and Human Development at New York University.
This article appeared in the Fall 2016 issue of Education Next. Suggested citation format:
Kempel, J.J. (2016). School Closures in New York City: Did students do better after their high schools were closed? Education Next, 16(4), 66-75.