Education writer and policy analyst Andy Smarick does not like efforts to turn around chronically underperforming schools. From the start of the Obama administration, Smarick has been emphatic that trying to fix low-performing schools is a waste of money and that the better strategy is to close them down and replace them with charters.
The latest study of the federal School Improvement Grant (SIG) program appears to confirm Smarick’s view, which he declared with chest-beating glee in a post on the EdNext blog. Asking if SIG represents “The greatest failure in the history of the U.S. Department of Education,” he pats himself on the back for predicting the program’s failure as early as 2009.
The Washington Post has quoted Smarick in virtually every article it has written about the SIG program. His message is always the same—turnarounds of struggling schools don’t work—even though a 2015 article based on an earlier descriptive analysis of SIG schools conducted by the Department of Education says, “Students in about two-thirds of the schools studied posted gains on math and reading tests.”
The article goes on to say that “Schools that participated in the program the longest showed the strongest improvements in math and reading…and the average high school graduation rate also increased for schools that received SIG.”
Nevertheless, the language of the 2017 report could not be more damning: “Overall, across all grades, we found that implementing any SIG-funded model had no significant impacts on math or reading test scores, high school graduation, or college enrollment.”
Ouch!
But, did the program really fail as badly as Smarick and this report suggest? And, if that is true, what are the consequences for school reform? If we couldn’t get results with $7 billion dollars, why spend any more money trying to fix schools?
The study is actually not as comprehensive as Smarick’s characterization suggests. By way of background, SIG targeted schools in the bottom five percent of each state, reaching about 1400 schools in all across six cohorts. This study’s analysis of the effect of receiving a SIG grant on student outcomes looked at fewer than 200 of those schools, all of which implemented a SIG-funded model in 2010-11. It looked at the effects on student achievement and high school graduation rates three years later.
Specifically, the study compared schools just below the bottom five percent eligibility line to those just above. This is sort of like comparing D+ schools with C- schools. It makes for a nice comparison, but, as Neerav Kingsland points out, because the study focused on such a small sample, it cannot rule out the possibility that SIG had substantial positive effects.
The fact that the study did not even look at the program’s effects on D- or F schools is also important because these schools had nowhere to go but up. As it turns out, that’s exactly what happened in some of them. When the 2015 analysis was released, Edweek reported that, “SIG schools were more likely to see double-digit gains in reading and math than other schools.”
The shame is that something good happened in many of these schools. There is anecdotal information everywhere. Smarick likes to point out that the plural of anecdote is not data. That’s true, of course, until it is. We know of state-level studies showing positive impacts of SIG-funded turnaround efforts in California, Massachusetts, Philadelphia and Memphis.
We also know that the number of dropout factories—with grad rates below 60 percent—is down to about 1200 nationwide—from nearly 2000 at the start of the century. Many of them were SIG schools and that may be one reason that the national high school graduation rate is at 83 percent today, up from about 75 percent in 2009.
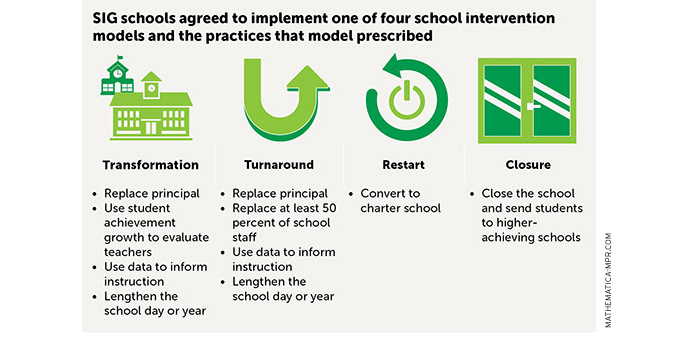
We also know that, given the four options allowed under SIG, 73 percent of the 1400 schools in the program chose the easiest and least aggressive “transformation” option, which required replacing the principal but none of the staff. It also required changes around curriculum and professional development—the kind of stuff schools do all the time with or without grants from Washington. Some do it better than others; some don’t do it all.
About 20 percent of the SIG schools chose the second option, the “turnaround” model, which required replacing at least half the staff. Just five percent chose the third option—closing down and reopening as a charter. And less than two percent chose the fourth option—closing the school and sending the students elsewhere.
The inescapable conclusion is that 1400 principals, their superintendents, and their states, mostly chose the easy path. They received, on average, about $5 million to be spent over three years. Some did some good work; some obviously didn’t.
So, who is to blame? The feds who designed the policy? The states that chose the schools and districts, distributed the money and were responsible for monitoring progress? The superintendents who chose the models and the principals? Or the principals themselves who actually did the work…or didn’t?
Let’s also keep that $7 billion number in perspective. Nationally, we spend more than $600 billion each year on education. Over five years (three annual cohorts each of which was funded for three years), that’s three trillion dollars.
To fix our worst schools, $7 billion is really just a drop in the bucket—less than one quarter of one percent of overall education spending during that time period. And, while $5 million per school over three years sounds like a lot of money, it really isn’t for a school that is deeply distressed, as most SIG schools were.
Smarick insists that replacing struggling schools with charters is a better approach but the evidence is pretty thin. The definitive 2013 large-scale study on charters, conducted by a conservative pro-charter think tank, concludes that just 29 percent of them are better than the surrounding neighborhood schools in math and 25 percent are better in reading.
When you cut the data to look just at urban charters, the percentage beating the surrounding neighborhood schools rises to 40 percent. In baseball, batting 400 is great. In education, it’s not quite time to pop the champagne corks, though it is clearly better than doing nothing.
Honest reflection and humility are important in the world of education, but the SIG story is more nuanced than Andy Smarick would have you believe. If we want public education to move forward, we should not be so quick to declare failures any more than we should prematurely trumpet our successes.
—Peter Cunningham
Peter Cunningham is the executive director of Education Post.