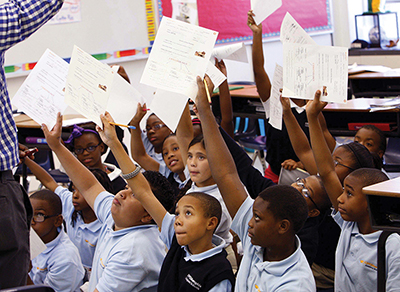
The Knowledge Is Power Program (KIPP) is a network of charter schools designed to improve the educational opportunities available to low-income families. KIPP schools seek to boost their students’ academic achievement and ultimately prepare them to enroll and succeed in college. To achieve these objectives, KIPP schools leverage strong student-behavior policies with rewards and sanctions; contracts between students, parents, and teachers; longer school days and school on Saturdays; substantial autonomy for principals; and close monitoring of school performance in terms of student achievement and college readiness. KIPP has grown from two middle schools established in the mid-1990s to a nationwide network of more than 140 elementary, middle, and high schools in 20 states and the District of Columbia in 2014.
AP Photo / Tennessee Daily Life / Alan Spearman
The majority of KIPP schools are middle schools that serve grades 5 through 8. Several rigorous studies have confirmed that many KIPP middle schools have large, positive impacts on student performance on math and reading tests. Our own study (the largest rigorous study of KIPP) estimated that over three years KIPP middle schools have an average cumulative impact of 0.21 standard deviations in reading and 0.36 standard deviations in math, roughly equivalent to an additional eight to 11 months of learning. KIPP’s ability to operate a large number of high-performing schools has attracted the attention of policymakers, including Secretary of Education Arne Duncan, who notes that “the KIPP network has debunked the myth that great schools are one-offs that cannot be replicated.” In just the past five years, KIPP has received tens of millions of dollars in federal grants to open new schools, in addition to a $50 million grant through the Investing in Innovation Fund to develop its school-leader training program.
Not everyone is convinced, however. Skeptics have asked whether attrition of students from KIPP schools may explain their apparent success and thereby raised doubts about the prospects for replicating that success at scale. For example, commentator Richard Kahlenberg has argued that “the big difference between KIPP and regular public schools…is that whereas struggling students come and go at regular schools, at KIPP, students leave but very few new students enter. Having few new entering students is an enormous advantage not only because low-scoring transfer students are kept out but also because in later grades, KIPP students are surrounded only by successful peers….”
Critiques like this do not deny that KIPP schools improve the achievement of the students who attend them, but rather argue that these improvements reflect advantageous enrollment patterns at KIPP that are not possible at traditional public schools. The key question is whether KIPP’s positive effects on learning are attributable to a peer environment that is more conducive to academic achievement than the peer environment found in traditional public schools. If so, traditional public schools may find it difficult to achieve comparable impacts by replicating the KIPP model.
Little systematic evidence exists on this question for the charter sector in general, much less for KIPP schools in particular. In this study, we use detailed student-level data to compare patterns of entry, attrition, and replacement in 19 KIPP middle schools and in traditional public middle schools in the districts in which the KIPP schools are located.
We find that, on average, KIPP middle schools admit students who are similar to those in other local schools, and patterns of student attrition are typically no different at KIPP than at nearby public middle schools. In both groups of schools, students who leave before completing middle school are substantially lower-achieving than those who remain. KIPP schools replace fewer of these students in the last two years of middle school, however, and, compared to district schools, KIPP schools tend to replace those who leave with higher-achieving students. Nonetheless, while this difference in replacement patterns is noteworthy, it cannot account for KIPP’s overall impact on student achievement. In particular, the literature on peer effects suggests that KIPP’s student replacement pattern could produce only a small fraction of KIPP’s actual impact on student achievement. A large part of KIPP’s cumulative effect occurs in students’ first year of enrollment, before attrition and replacement could have any effect.
Data

Getty Images/Chris Hondros/Newsmakers
We use data from 19 KIPP middle schools located in nine states and the District of Columbia for which we were able to obtain at least three years of complete administrative data that track students over time. These 19 middle schools constitute a little more than half of the 35 KIPP schools that opened their doors in 2005 or earlier. As is typical of KIPP middle schools, each of the schools in the sample serves students in grades 5–8. The key pieces of information for the study are test scores in reading and mathematics, demographic characteristics, and schools attended. These data include 7,143 students who enrolled in a KIPP school between school years 2001–02 and 2008–09 and 1,202,060 non-KIPP students enrolled in districts where a KIPP school is located.
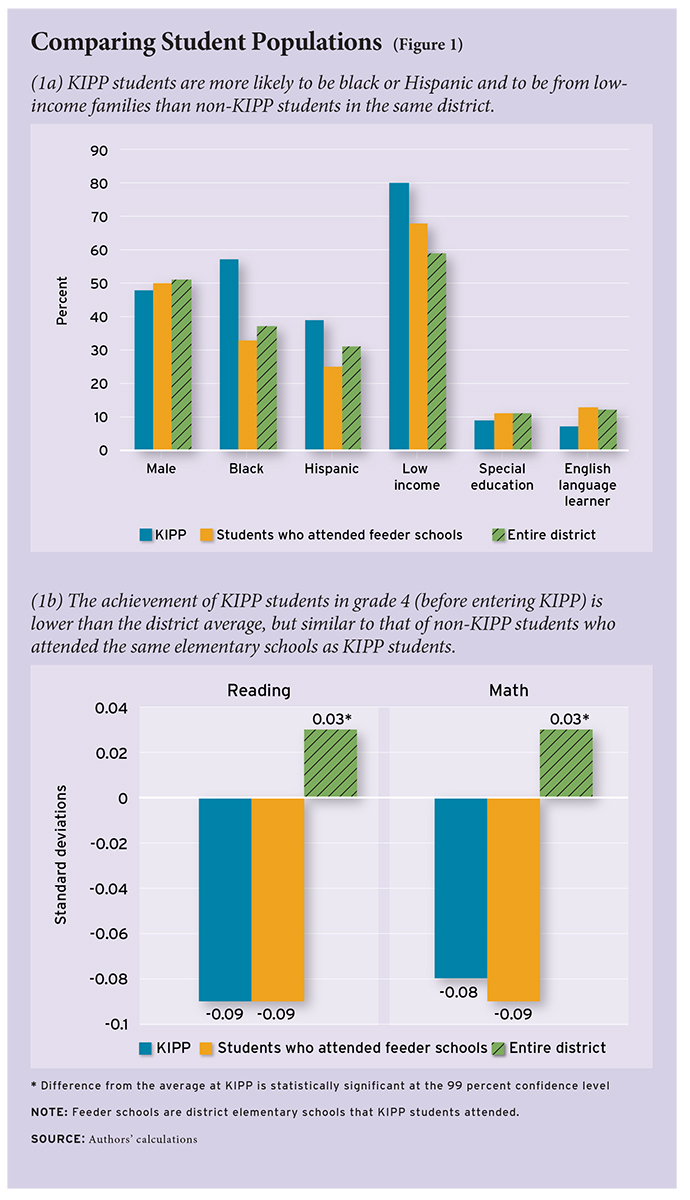
The students who attend the KIPP schools in the sample are quite disadvantaged, both in absolute terms and relative to the school districts in which they are located. In the year prior to entering a KIPP school, 80 percent of the KIPP students are from low-income families, as measured by eligibility for free or reduced-price school breakfast and lunch (FRPL); 96 percent are either black or Hispanic; 7 percent are English language learners; and 7 percent receive special education services (see Figure 1a). Compared with students district-wide, KIPP students are more likely to be black or Hispanic and from low-income families but slightly less likely to be English language learners or in special education. The same basic pattern holds if we compare KIPP students to only those non-KIPP students who attended the local elementary schools that KIPP students attended, i.e., those that effectively serve as KIPP “feeder” schools.
In terms of academic performance, KIPP students’ achievement in grade 4 (before entering KIPP) is lower than the district average by 0.09 standard deviations in reading and by 0.08 standard deviations in math, or roughly one-quarter of a grade level in each subject. KIPP students’ grade 4 achievement is very similar, however, to that of non-KIPP students who attended the feeder elementary schools (see Figure 1b). In other words, KIPP students start out academically behind the average student in their local school district, but this appears to reflect the communities in which KIPP schools have decided to open. Neither comparison would seem to indicate that KIPP schools succeed by serving a select group of students, but skeptics contend that these kinds of overall comparisons obscure more subtle patterns of selection that emerge as students in these districts transfer out of and into different middle schools.
Students Leaving KIPP Schools
To compare attrition rates at KIPP middle schools with rates at other public middle schools, we identified students who left their original schools either during or immediately after each middle school grade. We considered school-specific grade ranges and disregarded transfers caused by a normal grade progression, such as a move from an elementary school at the end of 5th grade to a middle school in 6th grade. All transfers out of the district or to private schools were classified as attrition.
For this portion of the study, we compare KIPP students with two groups of district school students: all those attending non-KIPP middle schools in the same district, and a smaller comparison group of students attending middle schools that accepted an above-average number of students from the feeder elementary schools. In other words, if students from feeder elementary schools eventually attend five different non-KIPP middle schools, the two most commonly attended of these middle schools would be included in the “comparison” middle-school group.
We do not find a consistent pattern of differences in attrition rates between KIPP and district schools (see Figure 2). At KIPP schools, the rate of attrition tends to decline moderately over the course of middle school. KIPP’s grade 5 attrition rate of 16 percent declines to 13 percent in grade 6 and to 9 percent in grade 7. The grade-specific attrition rates in the comparison middle-school group do not decline, with average rates of 11, 13, and 14 percent, respectively. Attrition rates in the full district fall between those of the KIPP schools and the comparison middle schools in each grade.
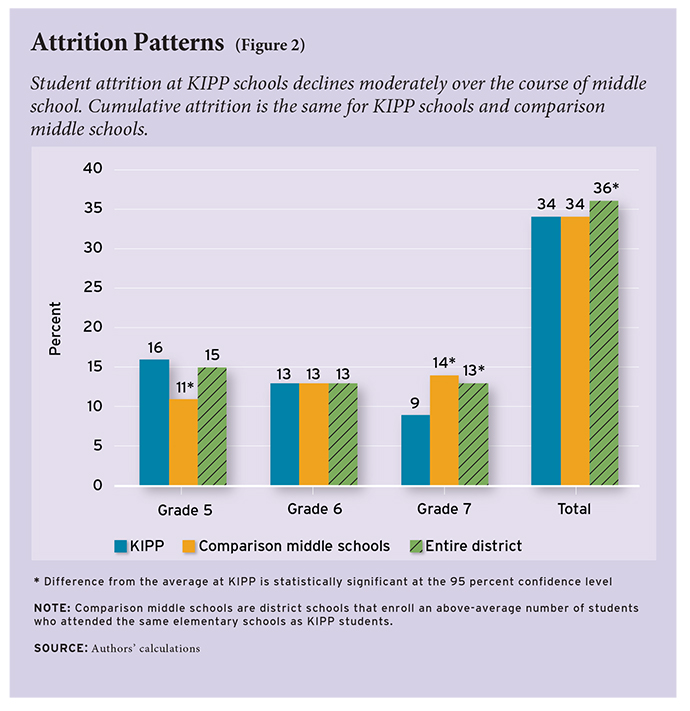
Over the entire course of middle school, cumulative attrition rates—the percentage of students entering 5th grade who change schools before completing 8th grade—is similar at KIPP schools and district schools. On average, the cumulative attrition rate at KIPP is 34 percent, compared with 34 percent in the comparison middle-school group and 36 percent in the district as a whole.
Despite the similarity in overall attrition rates in KIPP and comparison middle schools, cumulative attrition rates for black and Hispanic students are substantially lower in KIPP schools than in comparison middle schools. The attrition rate for black students is 37 percent at KIPP vs. 44 percent in the comparison group, and the attrition rate for Hispanic students is 24 percent at KIPP vs. 29 percent in the comparison group. There do not appear to be any notable differences between KIPP and comparison middle schools in attrition rates for students eligible for a free or reduced-price lunch.
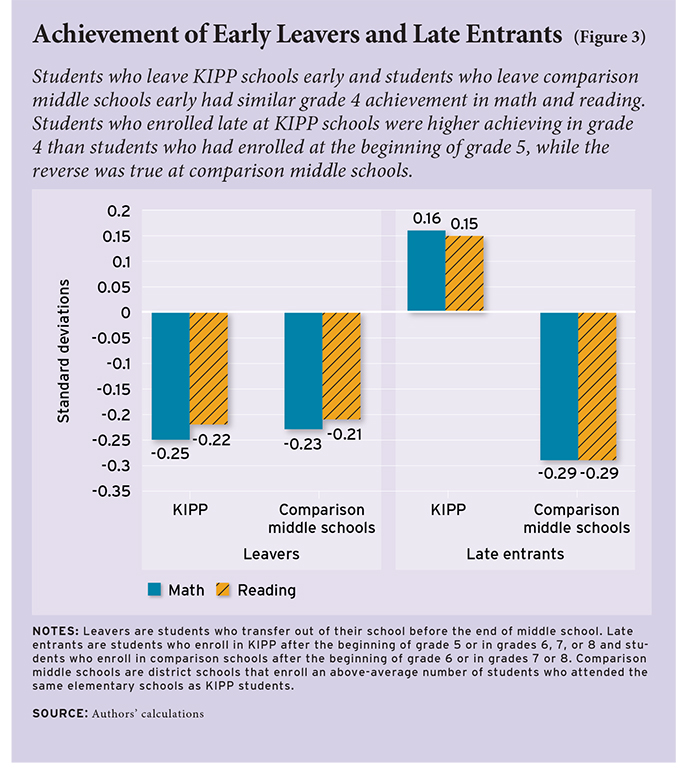
We also examine the characteristics of students who transfer early to determine the extent to which attrition may change the composition of students at KIPP and at the comparison middle schools. For both groups, students who leave early tend to have markedly lower grade 4 test scores than students who stay (see Figure 3). At KIPP, on average, students who leave score 0.25 and 0.22 standard deviations below the district-wide mean in math and reading at baseline (or at the 40th and the 41st percentiles, respectively); students who stay score 0.02 below the mean (the 49th percentile) in both subjects. In comparison middle schools, students who leave score 0.23 and 0.21 standard deviations below the mean in math and reading (or the 41st and the 42nd percentiles, respectively) at baseline; students who stay score 0.01 above the mean (the 50th percentile) in math and at the mean in reading.
The demographic composition of students transferring out of KIPP schools and out of comparison middle schools is also broadly similar. At both KIPP schools and comparison schools, students who leave early are significantly more likely to be black males and significantly less likely to have limited English proficiency than students who remain. Those who leave early from KIPP are also less likely to be Hispanic, whereas at comparison middle schools the proportion of Hispanic students who leave is nearly identical to the Hispanic proportion of students who remain enrolled. In addition, students who leave KIPP are no more likely than those who stay to be FRPL-eligible (both groups have high eligibility rates) or to be in special education, whereas students who leave comparison middle schools are more likely than those who stay to be FRPL-eligible and to participate in special education programs. Thus, if anything, it appears that the attrition from comparison middle schools is more likely than attrition from KIPP to draw away students who are disadvantaged relative to the students left behind.
Replacing Students Who Leave KIPP Schools
Attrition is not the only way that a school’s student body can change. Students who take the places of departing students represent another potentially important source of changes in a school’s overall enrollment. We define a late entrant as a student enrolling in a given school for the first time at any point other than that school’s normal entry grade. For example, in the case of a KIPP middle school serving grades 5 through 8, late entrants include students who enroll for the first time in grades 6, 7, or 8.
We examine two key issues related to late entrants. First, we calculate the number of late entrants relative to the number of students who leave the school early, in other words, the extent to which late entrants are admitted at all. Second, we examine whether the average achievement level of the new students is higher or lower than that of the students who enter the school in the normal entry grade.
Both KIPP and comparison middle schools admit late entrants, but at KIPP they are concentrated in earlier grades. All KIPP middle schools admit students after the normal entry grade, and most schools continue to admit at least some new students in every grade. The number of new enrollees declines substantially after grade 6, however. The KIPP schools in our study enroll an average of 13 new students per year in grade 6 (accounting for 18 percent of average total enrollment in that grade), 7 new students per year in grade 7 (12 percent of total enrollment), and 3 new students per year in grade 8 (6 percent of total enrollment).
KIPP schools admit more new students in grade 6 than the number of students who left through attrition in grade 5. Part of the explanation for this trend is the comparatively high rate of students who repeat grade 5 at KIPP schools. This trend reverses in later grades. In grades 7 and 8, KIPP schools admit slightly fewer new students than the number of students who left in the prior grade.
Comparison middle schools also consistently admit students after the normal entry grade. Unlike KIPP, however, these schools do not show any decline in new enrollment levels in grade 8 compared with grade 7. Rather, comparison middle schools consistently admit more new students, on average, than the number who exited through attrition in the prior grade. As a result, in grades 7 and 8, comparison middle schools are more likely than KIPP schools to replace the students who leave through attrition. Overall, however, the proportion of late entrants at KIPP (15 percent) is nearly identical to the overall proportion in the comparison middle schools (14 percent).
Although overall late-entry rates are similar, KIPP schools tend to differ from comparison middle schools in how those new students change the composition of the student body. Students who enroll late at KIPP tend to be higher-achieving than those who enroll on time, as measured by their grade 4 test scores, whereas the reverse is true at comparison middle schools (see Figure 3). On average, the 4th-grade math and reading test scores of KIPP late entrants were 0.15 to 0.16 standard deviations above the district average, putting them 0.19 standard deviations above the scores of students who enrolled in the normal intake grade. Conversely, late entrants at district schools had dramatically lower average 4th-grade test scores than on-time enrollees: 0.30 and 0.32 standard deviations lower in reading and math, respectively (in both cases, 0.29 standard deviations below the district average).
In addition to the substantial difference in test-score patterns, modest differences also exist between KIPP and comparison middle schools in the demographic characteristics of late entrants. Compared with on-time enrollees, KIPP’s late entrants are equally likely to qualify for FRPL and less likely (by 4 percentage points) to be in special education; in the comparison middle schools, in contrast, late entrants are significantly more likely (by 13 percentage points) to be FRPL-eligible and more likely (by 3 percentage points) to be in special education.
The Changing Composition of KIPP Students
Are the differences among late entrants large enough to notably change the types of students attending KIPP relative to those in district schools? To answer this question, we compare the characteristics of KIPP students in grades 5, 6, 7, and 8 with the characteristics of their peers across the district as well as of those non-KIPP students who attended the feeder elementary schools.
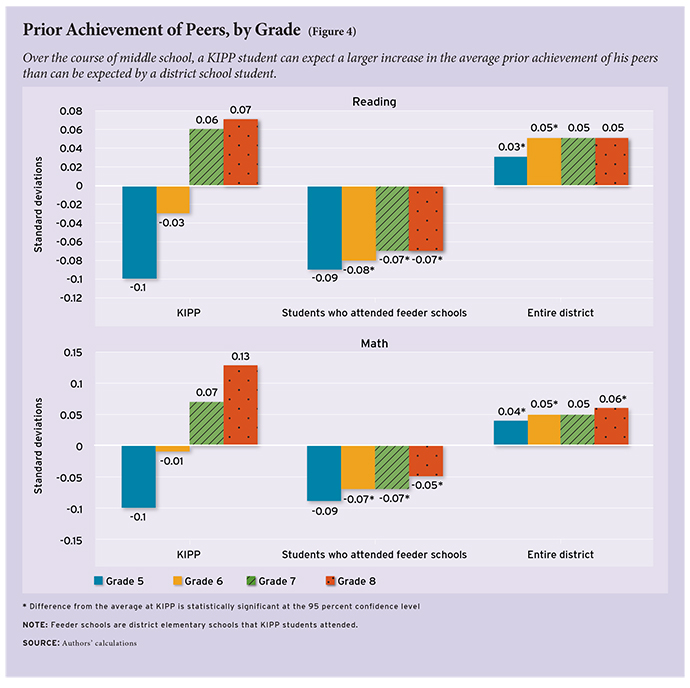
We find several noteworthy differences. Within KIPP schools, students in early grades have lower entering achievement levels, on average, than those in later grades, a pattern that is not evident at district schools. This is because those who left early and late entrants at district schools resemble each other—both groups of students tend to be relatively low-achieving. In contrast, a KIPP student can expect a large increase over time in the average grade 4 achievement of his peers. The increase in peer prior achievement from 5th to 8th grade at KIPP schools was 0.15 standard deviations greater in reading and 0.19 standard deviations greater in math than for students who attended feeder elementary schools (see Figure 4).
Unlike entering test scores, most demographic characteristics at KIPP schools remain stable throughout middle school. Throughout every grade of middle school, KIPP schools had a substantially higher proportion of blacks and Hispanics than district schools.
KIPP’s attrition and late-enrollment patterns do not appreciably change the proportion of students who were in special education, had limited English proficiency, or were FRPL-eligible when they entered. In district schools, the proportion of students with these attributes also remains similar in each of the grades we examined. In each grade of middle school, KIPP schools have significantly more FRPL-eligible students, significantly fewer special education students, and significantly fewer English language learners than district schools.
How Much Could Peer Effects Explain KIPP Impacts?
In light of research showing the positive impacts of KIPP schools on achievement, student transitions into and out of KIPP remain of interest. Policymakers supportive of KIPP wonder how much of the student population the KIPP network might grow to serve, and skeptics ask whether KIPP’s results depend on excluding students who are the most disadvantaged or the most difficult to teach, either in admissions or subsequent attrition.

AP Photo/The Commercial Appeal, Jim Weber
Our findings provide a picture of KIPP’s student population from several key angles. In terms of prior achievement, KIPP schools generally admit students who are disadvantaged in ways similar to their peers in nearby district schools. These disadvantaged populations have high rates of educational mobility, but rates of exit from KIPP schools are typically no higher than rates at nearby district schools. Students leaving KIPP schools have similar prior achievement to those leaving nearby middle schools, but the late entrants at KIPP schools tend to have had higher achievement than late entrants at these other schools.
How much of KIPP’s impact on student achievement might be explained by the fact that KIPP tends to attract higher-achieving new students in the upper grades? One way to estimate the possible size of peer effects at KIPP is to combine our findings with other research on how peers’ prior scores affect student achievement. Unfortunately, published estimates of the effect of peer ability on student achievement range widely, from close to zero to nearly half a standard deviation impact for each standard deviation of difference in peer achievement. Even if the largest estimates of peer effects are correct, however, the improvement in peers’ prior test scores would appear to benefit KIPP students’ achievement only by about 0.07 to 0.09 standard deviations after four years at KIPP. KIPP’s cumulative impacts in middle school are three times that size, so even the largest estimates of the size of peer effects suggest that they are unlikely to explain more than one-third of the cumulative KIPP impact.
Moreover, the best available evidence shows that KIPP produces large impacts on students in their first year at a KIPP school—before late-entering students could possibly have any effect. Consequently, the true peer effect resulting from late entrants is likely to be substantially below the back-of-the-envelope estimate of 0.07 to 0.09 standard deviations.
A potentially important limitation of this study is that there could still be unmeasured differences between the students attracted to KIPP and those enrolling in other schools. We analyze the peer environment at KIPP as measured by demographic characteristics and prior achievement, but we do not have direct measures of parent characteristics, prior motivation, or student behavior. For example, KIPP students might benefit from attending school with peers who are especially motivated to accept KIPP’s academic and behavioral demands. If this were true, the presence of motivated peers at KIPP could help bolster the effectiveness of the KIPP model, and it would call into question whether KIPP’s approach would be equally effective in conventional public schools.
But the data available for this analysis clearly show that KIPP’s impacts cannot be explained by advantages in the prior achievement of KIPP students. Even when attrition and replacement throughout the middle school years are taken into account, the limited range of potential peer effects at KIPP schools does not explain the large cumulative impacts on student achievement identified by prior studies. One implication of these findings is that the KIPP model may include practices that could be effective outside schools of choice. Whether these practices can be replicated in traditional public schools or raise academic achievement across the full range of traditional public-school students remains to be seen.
Ira Nichols-Barrer is a researcher at Mathematica Policy Research, Inc., where Brian Gill and Philip Gleason are senior fellows and Christina Clark Tuttle is also a senior researcher.
This article appeared in the Fall 2014 issue of Education Next. Suggested citation format:
Nichols-Barrer, I., Gill, B.P., Gleason, P., and Tuttle, C.C. (2014). Does Student Attrition Explain KIPP’s Success? Evidence on which students leave KIPP middle schools and who replaces them. Education Next, 14(4), 62-70.