Video: Paul Peterson and Marty West discuss the study.
An unabridged version of this article is available here.

In Vancouver last winter, the United States proved its competitive spirit by winning more medals—gold, silver, and bronze—at the Winter Olympic Games than any other country, although the German member of our research team insists on pointing out that Canada and Germany both won more gold medals than the United States. But if there is some dispute about which Olympic medals to count, there is no question about American math performance: the United States does not deserve even a paper medal.
Maintaining our productivity as a nation depends importantly on developing a highly qualified cadre of scientists, engineers, entrepreneurs, and other professionals. To realize that objective requires a system of schooling that produces students with advanced math and science skills. To see how well schools in the United States do at producing high-achieving math students, we compared the percentage of U.S. students in the high-school graduating Class of 2009 with advanced skills in mathematics to percentages of similarly high achievers in other countries.
Unfortunately, we found that the percentage of students in the U.S. Class of 2009 who were highly accomplished in math is well below that of most countries with which the United States generally compares itself. No fewer than 30 of the 56 other countries that participated in the Program for International Student Assessment (PISA) math test, including most of the world’s industrialized nations, had a larger percentage of students who scored at the international equivalent of the advanced level on our own National Assessment of Educational Progress (NAEP) tests. Moreover, while the percentage of students scoring at the advanced level on NAEP varies considerably among the 50 states, not even the best state does well in international comparison. A 2005 report from the National Academy of Sciences, Rising Above the Gathering Storm, succinctly put the issue into perspective: “Although many people assume that the United States will always be a world leader in science and technology, this may not continue to be the case inasmuch as great minds and ideas exist throughout the world.”
The Demand for High Achievers
The gap between the burgeoning business demand for a highly accomplished workforce and a lagging education system has steadily widened. Even as the United States was struggling with a near 10 percent unemployment rate in the summer of 2010, businesses complained that they could not find workers with needed skills. New York Times writer Motoko Rich explained, “The problem…is a mismatch between the kind of skilled workers needed and the ranks of the unemployed.”
Skill shortages have severe consequences for a nation’s overall productivity. Two of the authors of this report have shown elsewhere that countries with students who perform at higher levels in math and science show larger rates of increase in economic productivity than do otherwise similar countries with lower-performing students (see “Education and Economic Growth,” research, Spring 2008).
Public discourse has tended to focus on the need to address low achievement, particularly among disadvantaged students. Both federal funding and the accountability elements of No Child Left Behind (NCLB) have stressed the importance of bringing every student up to a minimum level of proficiency. As great as this need may be, there is no less need to lift more students, no matter their socioeconomic background, to high levels of educational accomplishment. In 2006, the Science, Technology, Engineering, and Mathematics (STEM) Education Coalition was formed to “raise awareness in Congress, the Administration, and other organizations about the critical role that STEM education plays in enabling the U.S. to remain the economic and technological leader of the global marketplace for the 21st Century.” In the words of a National Academy of Sciences report that jump-started the coalition’s formation, the nation needs to “increase” its “talent pool by improving K–12 science and mathematics education.”
 A Focus on Math
We give special attention to math performance because math appears to be the subject in which accomplishment in secondary school is particularly significant for both an individual’s and a country’s economic well-being. Existing research, though not conclusive, indicates that math skills better predict future earnings and other economic outcomes than other skills learned in high school. The American Diploma Project estimates that “in 62 percent of American jobs over the next 10 years, entry-level workers will need to be proficient in algebra, geometry, data interpretation, probability and statistics.”
There is also a technical reason for focusing our analysis on math. This subject is particularly well suited to rigorous comparisons across countries and cultures. There is a fairly clear international consensus on the math concepts and techniques that need to be mastered and on the order in which those concepts should be introduced into the curriculum. The knowledge to be learned remains the same regardless of the dominant language spoken in a culture.
Data and Methodology
Our analysis relies on test-score information from NAEP and PISA. NAEP, the National Assessment of Educational Progress, is often called the nation’s report card. It is a large, nationally representative assessment of student performance in public and private schools in mathematics, reading, and science that has been administered periodically since the early 1970s to U.S. students in 4th grade and 8th grade, and at the age of 17. PISA, the Program for International Student Assessment, is an internationally standardized assessment of student performance in mathematics, science, and reading established by the Organisation for Economic Co-operation and Development (OECD). It was administered in 2000, 2003, and 2006 to representative samples of 15-year-olds in all 30 OECD countries (which include the most developed countries of the world) as well as in many others.
We focus on performance of the international equivalent of the U.S. high-school graduating Class of 2009 at the time when this population was in the equivalent of U.S. grades 8 and 9. NAEP was administered to U.S. 8th graders in 2005, while PISA 2006 was given one year later to students at the age of 15, the year at which most American students are in 9th grade.
In 2005, NAEP tested representative samples of 8th-grade public and private school students in each of the 50 states in math, science, and reading. For each state, NAEP 2005 calculates the percentage of students who meet a set of achievement standards: a “basic” level, a “proficient” level, and an “advanced” level of achievement. The focus of this report is the top performers, the percentage of students NAEP found at the advanced level of achievement (subsequently referred to as “advanced”).
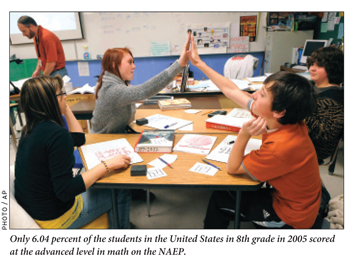
Only 6.04 percent of the students in the United States in 8th grade in 2005 scored at the advanced level in math on the NAEP. Some critics feel that the standard set by the NAEP governing board is excessively stringent. However, the 2007 Trends in International Math and Science Study (TIMSS 2007), another international test that has been administered to students throughout the world, appears to have set a standard very similar to NAEP 2005, as only 6 percent of U.S. 8th graders scored at the advanced level on that test as well.
We use the NAEP 2005 advanced standard to compare U.S. performance with that in other countries. Because U.S. students took both NAEP 2005 and PISA 2006, it is possible to find the score on PISA that is tantamount to scoring at the advanced level on NAEP, i.e., the score that will yield the same percentage of students as the percentage of U. S. students who scored at the advanced level on the NAEP.
A score on PISA 2006 of 617.1 points is equivalent to the lowest score attained by anyone in the top 6.04 percent of U.S. students in the Class of 2009. (The PISA assessment has an average score of 500 among OECD students and a standard deviation of 100.) It is assumed that both NAEP and PISA tests randomly select questions from a common universe of mathematics knowledge. Given that assumption, it may be further assumed that students who scored similarly on the two exams will have similar math knowledge, i.e., students who scored 617.1 points or better on the PISA test would have been identified at the advanced level had they taken the NAEP math test. Inasmuch as a score of 617.1 points is more than one standard deviation above the average student score on the PISA, it is clear that a group of highly accomplished students has been isolated. (For more methodological details, see sidebar.)
We start with the national share of 8th-grade U.S. public and private school students (most of whom are 14 years of age) who reach the advanced level in math on NAEP 2005: 6.04 percent. These students are assumed to be part of the cohort of 15-year-olds who participated in PISA 2006 one year later. Thus, using the PISA 2006 microdata, we can calculate the PISA math test score at which the 93.96th percentile (100.00 – 6.04) of the U.S. student population performs. All PISA calculations use the PISA sampling weights to yield nationally representative estimates. The PISA scaling methodology returns student performance estimates through a range of five plausible values, which are random draws from the estimated probability distribution for a student’s underlying performance. We perform our analysis separately for each of the five plausible values provided by PISA 2006. We then average these results. Based on these calculations, we estimate the PISA score at which the 93.96th percentile of the U.S. student population performs to be 617.1 PISA points.
Next, we calculate from the PISA microdata the share of students reaching this cutoff point for each country participating in the PISA 2006 test. This provides an estimate of the share of students in each PISA country who reach the equivalent of the advanced level in 8th-grade math on NAEP 2005. The share of students who reach the advanced level in 8th-grade math in each U.S. state is taken from NAEP 2005. For information on the statistical significance of differences among jurisdictions, see the unabridged version of this study, available here.
Because representative samples of student performance on NAEP 2005 are available for each state, it is possible to compare the percentages of students in the Class of 2009 who were at the advanced level for each state to the percentage of equally skilled students in countries from around the globe.
In short, linking the scores of the Class of 2009 on NAEP 2005 and PISA 2006 provides us with the opportunity to assess from an international vantage point how well the country as well as individual states in the United States are doing at lifting students to high levels of accomplishment.
U. S. Math Performance in World Perspective
We begin with an overall assessment of the relative percentages of young adults in the United States and other countries who have reached a very high level of mathematics achievement. It is frequently noted that the United States has a very heterogeneous population, with large numbers of immigrants. Such a diverse population, with students coming to school with varying preparation, may handicap U.S. performance relative to that of other countries. For this reason, we also examine two U.S. subgroups conventionally thought to have better preparation for school—white students and students from families where at least one parent is reported to have received a college degree—and compare the percentages of high-achieving students among them to the (total) populations abroad.
Overall results. The percentage of students in the U.S. Class of 2009 who were highly accomplished is well below that of most countries with which the United States generally compares itself. While just 6 percent of U.S. students earned at least 617.1 points on the PISA 2006 exam, 28 percent of Taiwanese students did. (See Figure 1 for these results as well as for the international rank of each U.S. state.)
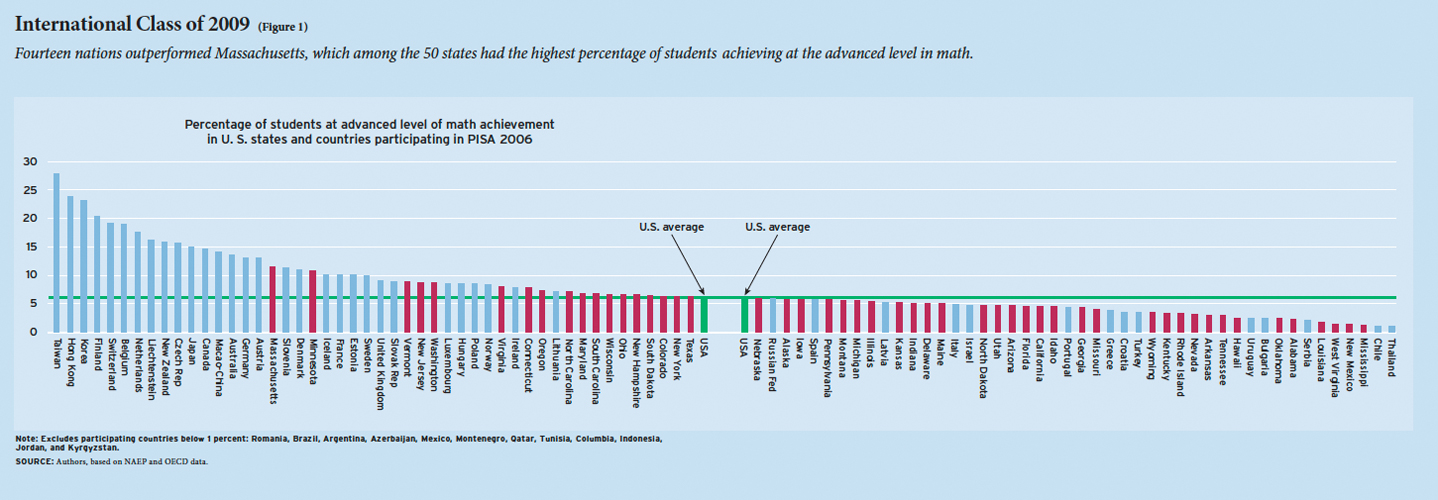
It is not only Taiwan that did much, much better than the United States. At least 20 percent of students in Hong Kong, Korea, and Finland were similarly highly accomplished. Twelve other countries had more than twice the percentage of advanced students as the United States: in order of math excellence, they are Switzerland, Belgium, the Netherlands, Liechtenstein, New Zealand, the Czech Republic, Japan, Canada, Macao-China, Australia, Germany, and Austria.
The remaining countries that educate a greater proportion of their students to a high level are Slovenia, Denmark, Iceland, France, Estonia, Sweden, the United Kingdom, the Slovak Republic, Luxembourg, Hungary, Poland, Norway, Ireland and Lithuania.
The 30-country list includes virtually all the advanced industrialized nations of the world. The only OECD countries producing a smaller percentage of advanced math students than the United States are Portugal, Greece, Turkey, and Mexico. The performance levels of students in Spain and Italy are statistically indistinguishable from those of students in the United States, as are those of students in Latvia, which has subsequently joined the OECD.
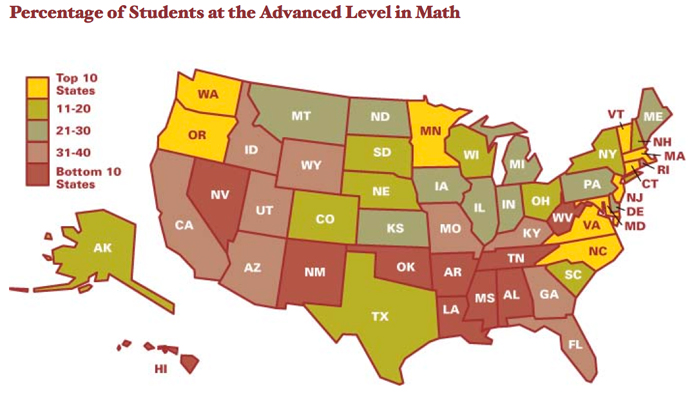
State-level performance. The percentage of students scoring at the advanced level varies among the 50 states. Massachusetts, with over 11 percent of its students at the advanced level, does better than any other state, but its performance trails that of 14 countries. Its students’ achievement level is similar to that of Germany and France. Minnesota, with more than 10 percent of its students at the advanced level, ranks second among the 50 states, but it trails 16 countries and performs at the level attained by Slovenia and Denmark. New York and Texas each have a percentage of students scoring at the advanced level that is roughly comparable to the United States as a whole, Lithuania, and the Russian Federation.
Just 4.5 percent of the students in the Silicon Valley state of California are performing at a high level, a percentage roughly comparable to that of Portugal. The lowest-ranking states—West Virginia, New Mexico, and Mississippi—have a smaller percentage of the highest-performing students than Serbia or Uruguay, although they do edge out Romania, Brazil, and Kyrgyzstan.
In short, the percentages of high-achieving students in the United States—and in most of its individual states—are shockingly below those of many of the world’s leading industrialized nations. Results for many states are at a level equal to those of third-world countries. (Click the image below for an interactive map providing specific information for each state.)
White students. The overall news is sobering. Some might try to comfort themselves by saying the problem is limited to large numbers of students from immigrant families, or to African American students and others who have suffered from discrimination. For example, the statement by the STEM Coalition that we “encourage more of our best and brightest students, especially those from underrepresented or disadvantaged groups, to study in STEM fields” suggests that the challenges are concentrated in nonwhite segments of the U.S. population.
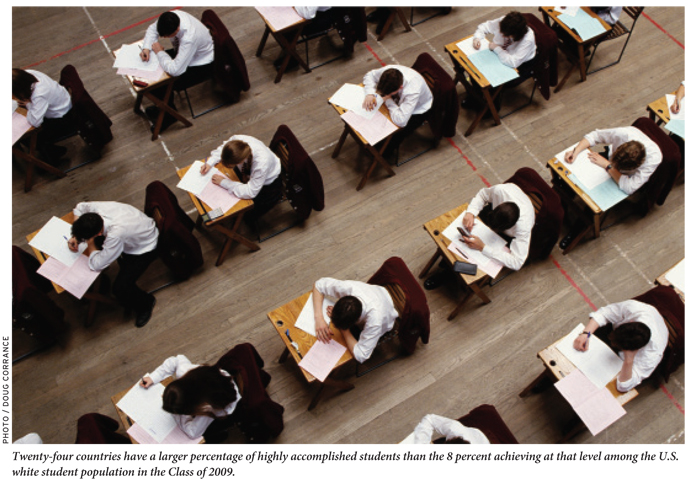
Without denying that the paucity of high-achieving students within minority populations is a serious issue, let us consider the performance of white students for whom the case of discrimination cannot easily be made. Twenty-four countries have a larger percentage of highly accomplished students than the 8 percent achieving at that level among the U.S. white student population in the Class of 2009. Looking at just white students places the U.S. at a level equivalent to what all students are achieving in the United Kingdom, Hungary, and Poland. Seven percent of California’s white students are advanced, roughly the percentage for all Lithuanian students.
Children of parents with college degrees. Another possibility is that schools help students reach levels of high accomplishment if parents are providing the necessary support. To explore this possibility, we assumed that students who reported that at least one parent had graduated from college were likely to be given the kind of support that is needed for many to reach high levels of achievement. Approximately 45 percent of all U.S. students reported that at least one parent had a college degree.
The portion of students in the Class of 2009 with a college-graduate parent who are performing at the advanced level is 10.3 percent. When compared to all students in the other PISA countries, this advantaged segment of the U.S. population was outranked by students in 16 other countries. Nine percent of Illinois students with a college-educated parent scored at the advanced level, a percentage comparable to all students in France and the United Kingdom. The percentage of highly accomplished students from college-educated families in Rhode Island is just short of 6 percent, the same percentage for all students in Spain, Italy, and Latvia.
The Previous Rosy Gloss
Many casual observers may be surprised by our findings, as two previous, highly publicized studies have suggested that—even though improvement was possible—the U.S. was doing all right. This was the picture from two reports issued by Gary Phillips of the American Institutes for Research, who compared the average performance in math of 8th-grade students in each of the 50 states with the average scores of 8th-grade students in other countries. These comparisons used methods that are similar to ours to relate 2007 NAEP performance for U.S. students to both TIMSS 2003 and TIMSS 2007. His findings are more favorable to the United States than those shown by our analyses. While our study using the PISA data shows U.S. student performance in math to be below 30 other countries, Phillips found the average U.S. student to be performing better than all but 14 other countries in his 2007 report and all but 8 countries in his 2009 report. (Oddly, the 2007 report takes a much more buoyant perspective than the 2009 report, though the data suggest otherwise.) Phillips also finds that individual states do much better vis-à-vis other countries than we report.
Why do two studies that seem to be employing generally similar methodologies produce such strikingly different results?
The answer to that puzzle is actually quite simple and has little to do with the fact that Phillips compares average student performance while our study focuses on advanced students: many OECD countries, including those that had a high percentage of high-achieving students, participated in PISA 2006 (upon which our analysis is based) but did not participate in either TIMSS 2003 or TIMSS 2007, the two surveys included in the Phillips studies. In fact, 19 countries that outscored the U.S. on the PISA 2006 test did not participate in TIMSS 2003, and 22 higher-scoring countries did not participate in TIMSS 2007. As a report by the U.S. National Center for Education Statistics has explained, “Differences in the set of countries that participate in an assessment can affect how well the United States appears to do internationally when results are released.”
Put starkly, if one drops from a survey countries such as Canada, Denmark, Finland, France, Germany, and New Zealand, and includes instead such countries as Botswana, Ghana, Iran, and Lebanon, the average international performance will drop, and the United States will look better relative to the countries with which it is being compared.
Did NCLB shift the focus away from the best and the brightest?
Some attribute the comparatively small percentages of students performing at the advanced level to the focus of the 2002 federal accountability statute, No Child Left Behind, on the educational needs of very low performing students. That law mandates that every student be brought up to the level a state deems proficient, a standard that most states set well below NAEP’s proficient standard, to say nothing of the advanced level that is the focus of this report.
In order to comply with the federal law, some assert, schools are concentrating all available resources on the educationally deprived, leaving advanced students to fend for themselves. If so, then we should see a decline in the percentage of students performing at NAEP’s advanced level subsequent to the passage of the 2002 federal law. In mathematics, however, the opposite has happened. The percentage performing at the advanced level was only 3.7 percent in 1996 and 4.7 percent in the year 2000. But the percentage performing at an advanced level climbed steadily to the 7.9 percent attained in 2009.
Perhaps NCLB’s passage in 2002 dampened the prior rate of growth in the achievement of high-performing students. To ascertain whether that was the case, we compared the rate of change in the NAEP math scores of the top 10 percent of all 8th graders between 1990 and 2003 (before NCLB was fully implemented) with the rate of change after NCLB had become effective law. Between 1990 and 2003, the scores of students at the 90th percentile rose from 307 to 321, an increment of 14 points, or a growth rate of 1.0 points a year. Between 2003 and 2009, the shift upward for the 90th percentile was another 8 points, or a change of 1.3 points a year. Our results are confirmed by a more detailed study of NCLB’s impact on high-performing students conducted by economists Brian Jacob and Thomas Dee.
In short, the incapacity of American schools to bring students up to the highest level of accomplishment in mathematics is much more deepseated than anything induced by recent federal legislation.
Conclusions
The economic and technological demand for a talented, well-educated, highly skilled population has never been greater. Not only must everyday workers have a set of technical skills surpassing those needed in the past, but a cadre of highly talented professionals trained to the highest level of accomplishment is needed to foster innovation and growth. In the words of President Barack Obama, “Whether it’s improving our health or harnessing clean energy, protecting our security or succeeding in the global economy, our future depends on reaffirming America’s role as the world’s engine of scientific discovery and technological innovation. And that leadership tomorrow depends on how we educate our students today, especially in math, science, technology, and engineering.”
Unfortunately, the United States trails other industrialized countries in bringing a large proportion of its students up to the highest levels of accomplishment. This is not a story of some states doing well but being dragged down by states that perform poorly. Nor is it a story of immigrant or disadvantaged or minority students hiding the strong performance of better-prepared students. Comparatively small percentages of white students are high achievers. Only a small proportion of the children of our college-educated population is equipped to compete with students in a majority of OECD countries.
Major policy initiatives within the United States have in recent years focused on the educational needs of low-performing students. Such efforts deserve commendation, but they can leave the impression that there is no similar need to enhance the education of those students the STEM coalition has called “the best and brightest.” Yet, with rapidly advancing technologies in an increasingly integrated world economy, no one doubts the extraordinary importance of highly accomplished professionals.
Admittedly, the United States could simply ignore the needs of its own young people and continue to import highly skilled scientists and engineers who were prepared by better-performing schools abroad. But even such a heartless, irresponsible strategy relies on both the nature of immigration policies and the absence of better opportunities abroad, two things on which we might not want the future to depend. It seems much more prudent to encourage the most capable of our own people to reach high levels of academic accomplishment.
Eric A. Hanushek is senior fellow at the Hoover Institution of Stanford University. Paul E. Peterson is the director of Harvard’s Program on Education Policy and Governance and senior fellow at the Hoover Institution. Ludger Woessmann is professor of economics at the University of Munich.
This article appeared in the Winter 2011 issue of Education Next. Suggested citation format:
Hanushek, E.A., Peterson, P.E., and Woessmann, L. (2011). Teaching Math to the Talented: Which countries—and states—are producing high-achieving students? Education Next, 11(1), 10-19.