Executive Summary
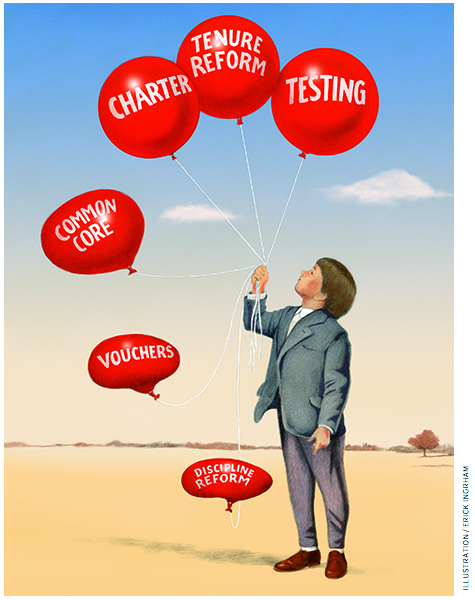
In its 10th annual survey of American public opinion, conducted in May and June of 2016, Education Next finds that the demise of school reform has been greatly exaggerated. Public support remains as high as ever for federally mandated testing, charter schools, tax credits to support private school choice, merit pay for teachers, and teacher tenure reform. However, backing for the Common Core State Standards and school vouchers fell to new lows in 2016. As in previous polls, Democrats are more supportive of Common Core than Republicans are, and we find polarization along party lines on several other issues. Surprisingly, more Democrats than Republicans support vouchers targeted to low-income students, tax credits, and vouchers for all families (universal vouchers).
 Note: Throughout our analysis, we disregard all neutral responses to poll questions and base our percentages only on responses indicating a position either in favor of or opposed to the proposal in question.
Standards, Testing, and Accountability
Common Core State Standards. In 2016, 50% of all those taking a side say they support the use of the Common Core standards in their state, down from 58% in 2015 and from 83% in 2013. Republican backing has plummeted from 82% in 2013 to 39% in 2016. The slip among Democrats is from 86% to 60% over this time period. Eighty-seven percent of teachers supported the initiative in 2013, but that fell to 54% in 2014 and to 44% in 2015, stabilizing at that level in 2016.
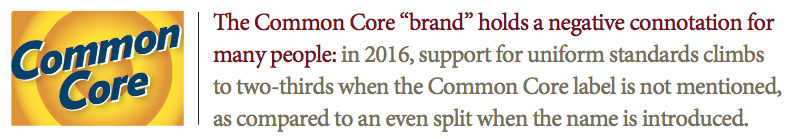
Same standards in general. When “Common Core” is not mentioned, two-thirds back the use of the same standards across states as compared to an even split when the name Common Core is included in the question. The Common Core “brand” is particularly toxic to Republicans, who are 22 percentage points less likely to respond favorably when the name is mentioned, as compared to a differential of 10 percentage points among Democrats.
Testing. Nearly four out of five respondents, about the same as in 2015, favor the federal requirement that all students be tested in math and reading in each grade from 3rd through 8th and at least once in high school. Support among Republicans, at 74%, is only modestly lower than among Democrats, at 80%. However, teacher support for testing, at 52%, is much lower.
Parental opt-out. Seventy percent of the public oppose letting parents opt their children out of state tests, the same percentage as in 2015. Among teachers, opposition to opt-out has declined from 64% in 2015 to 57% in 2016.
Charter schools. Overall public support for charters has remained quite stable since 2013. In 2016 the share favoring charters is 65%, roughly the same as in the past four years. Seventy-four percent of Republicans back charters, but only 58% of Democrats do, a gap of 16 percentage points between the parties.
School vouchers. Suprisingly, backing for both targeted and universal vouchers is greater among Democrats than Republicans, though public support for both types has declined. Whereas 55% of the general public favored targeted vouchers in 2012, only 43% do in 2016. The decline was particularly severe among Republicans, falling from 51% to 37%. Among Democrats, support slipped from 58% to 49%.
The popularity of vouchers for all families (universal vouchers) has also reached a new low. In 2014, they were favored by 56% of the public, but only 50% back them in 2016. When it comes to universal vouchers, 51% of Republicans liked the idea in 2014, while just 45% do in 2016. Democratic support for such vouchers has increased from 49% in 2013 to 56% in 2016.
Tuition tax credits. In 2016, 65% of the public say they favor tax credits for donations to foundations that help low-income students attend private schools, reflecting a modest decline from 70% support in 2013. The policy finds greater support among Democrats, at 69%, than among Republicans, at 60%. Just 47% of teachers favor tax credits.
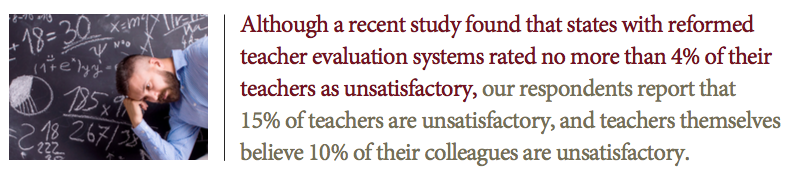
Teacher effectiveness. In 2016, Matt Kraft of Brown University and Allison Gilmour of Vanderbilt studied the ratings teachers received in 19 states that had reformed their teacher evaluation systems. In no state did the fraction receiving an unsatisfactory rating exceed 4%. To see whether the public—and teachers themselves—hold similarly sanguine views of teacher performance, we asked respondents to indicate the percentage of teachers in their local schools they would assign to each of four categories: unsatisfactory, satisfactory, good, and excellent. On average, respondents rate 15% of teachers as unsatisfactory. Teachers give the unsatisfactory rating to 10% of their colleagues.
Merit pay. Asked their opinion on “basing part of the salaries of teachers on how much their students learn,” 60% of the public express support for the idea in 2016. That percentage has remained relatively constant since 2008. Sixty-three percent of Republicans favor merit pay, as compared to 57% of Democrats. Teachers remain largely united in opposition to merit pay, with just 20% expressing support.
Tenure. Asked about support for “giving tenure to teachers,” just 31% of the public express a favorable view in 2016, a figure that has declined by 10 percentage points since 2013. Forty-one percent of Democrats and just 29% of Republicans favor teacher tenure. The public’s opposition to tenure contrasts with 67% support for the practice among teachers.
Teachers unions. Just short of half (49%) of respondents say unions have a generally positive effect on schools. Democratic and Republican views diverge, with 65% of the former and just 31% of the latter taking that position. In 2016, 76% of teachers say unions have a generally positive effect, an increase from 64% in 2013.
The percentage of the public who said at least 30% of instructional time in high school should be spent on a computer declined from 60% to 2015 to 55% in 2016. Among parents, the change was from 57% to 51%.
In 2016, 55% of people give their local schools either an A or a B, a higher share than at any point in the past 10 years. Over the course of the decade, the shift upward has been from 43% to 55%. However, only 25% give the nation’s schools as a whole one of these top grades.
Racial Disparities in School Discipline
Only 28% of teachers and of the general public favor a federal policy that prevents schools from expelling or suspending black and Hispanic students at higher rates than other students, a percentage that has not changed over the past year. In 2016, 48% of black respondents express support for the idea, down from 65% in 2015. Among Hispanic respondents, 39% express support, about the same as one year ago.
Per pupil expenditures. In 2016, 61% of the public favor an increase in per pupil expenditures, but when told their district’s current spending level before the question is posed, only 45% favor an increment. When people are asked to estimate per pupil spending in their local school districts, the average response in 2016 is $7,020, a little more than 50 percent of the actual per pupil expenditure of $12,440.
Teacher salaries. When respondents are asked in 2016 to estimate the average teacher salary in their state, their guesses are, on average, 30% lower than the amount reported by the National Education Association. When given this information before the question is posed, only 41% say salaries should be boosted; if not given this information, 65% favor a pay hike.
These results are based upon a nationally representative sample of adults (ages 18 and older) and representative oversamples of the following subgroups: parents with school-age children living in their home (1,571) and teachers (609). Total sample size is 4,181. Respondents could elect to complete the survey in English or Spanish. The survey was conducted from May 6 to June 13, 2016, by the polling firm Knowledge Networks (KN), a GfK company. Respondents are asked whether they “strongly” or “somewhat” support or oppose proposals about which their opinion is being solicited. They are also offered a fifth choice: “neither support nor oppose.” We ignore those who take this neutral position and calculate the percentages favoring and opposed as a proportion of only those taking a position on one side or another.
The year 2016 marks the 10th anniversary of the Education Next poll on K–12 education policy, offering us the opportunity to take a retrospective look at public opinion on this vital topic. In 8 of the past 10 years, we have also surveyed teachers on the subject and have seen some interesting differences between the thinking of these educators and the public at large. And this year, given that public opinion on many national issues is riven by partisan disparities, we compare and contrast the views of Republicans and Democrats.
On many topics, we find that opinion has remained consistent over the past 10 years. We see only slight changes in people’s views on the quality of the nation’s schools, for instance, or on federally mandated testing, charter schools, tax credits to support private school choice, merit pay for teachers, or the effects of teachers unions. But on other issues, opinions have changed significantly. Support for the Common Core State Standards has fallen to a new low in 2016. So has public backing for school vouchers—both those limited to low-income families and those made available to all families. Support for tenure has fallen, but approval for teacher salary hikes has climbed to levels not seen since the U.S. recession of 2008 among respondents not told about current salary levels. But fewer members of the public and fewer parents think at least 30% of the high school day should be devoted to students receiving instruction on a computer. Also, people think better of their local public schools in 2016 than they did in 2007.
On numerous issues, a partisan divide persists. From Common Core and charter schools to merit pay and teacher tenure, from school spending and teacher salaries to union impact on schools, the opinions of Democrats differ in predictable ways from those held by Republicans. But the partisan split does not always fall out exactly as opinion leaders expect. Surprisingly, school vouchers targeted toward low-income families command greater backing among Democrats than Republicans. The same is true for tax credits for donations to fund scholarships for students from low-income families who attend private school. Even universal vouchers for all students garner greater support among the partisans who predominate in Blue States rather than Red States.
Other results from the 2016 survey are no less intriguing. We shall see, for example, that members of the public, on average, think that 15% of all teachers at their local schools are performing at an unsatisfactory level. What’s more, teachers themselves, on average, think that 10% of their colleagues are unsatisfactory. People also remain adamantly opposed to policies that mandate equal suspension and expulsion rates across racial lines, despite ongoing efforts in this direction by the Obama administration. All this, and more, is spelled out in the following discussion and in the two interactive graphics available here and here.
Common Core, Accountability, and Testing
Public thinking on these issues is complex. On one hand, Americans continue to support state and federal policies that require schools to assess student progress toward meeting state-designated performance standards. On the other, they are steadily turning against the most prominent initiative to do just that—the Common Core State Standards.
Common Core. Should standards setting out expectations for students at each grade level be uniform throughout the United States? Such standards are commonly used in other countries but have generated great controversy here. The Common Core State Standards Initiative, an effort launched by the National Governors Association and the Council of Chief State School Officers in 2009 to establish uniform standards, initially proved so popular among policymakers that 45 states had, by 2011, agreed to participate. That undertaking became steadily more controversial, however, as the standards were implemented and tests were devised to measure student performance against them (see “The Politics of the Common Core Assessments,” features, Fall 2016). While the standards remain in place in most states, they are opposed by conservative groups that fear expanded federal control and by teachers unions wary of their use in teacher evaluations.
For several years EdNext has gauged public support for Common Core by asking the following question:
As you may know, in the last few years states have been deciding whether or not to use the Common Core, which are standards for reading and math that are the same across the states. In the states that have these standards they will be used to hold public schools accountable for their performance. Do you support or oppose the use of the Common Core standards in your state?
In 2012, the first year EdNext inquired about Common Core, 90% of those who took one side or the other said they favored the standards. But as the Common Core debate intensified, support steadily eroded (see Figure 1a). In 2013, favorable opinion slipped to 83%; it fell to 58% in 2015 and to just 50% in 2016. Republicans have made the largest shift away from Common Core over the past five years. Their backing plummeted from 82% in 2013 to 43% in 2015 and is down to 39% in 2016. The initial slip among Democrats was less dramatic—from 86% to 70% between 2013 and 2015. But in 2016 Democratic support has fallen further, to 60%. Still, Democrats, unlike Republicans, are more likely to back than to oppose Common Core. (As detailed in the methodological sidebar, all the percentages reported in this essay exclude respondents who are neutral on any given question—that is, those who select the “neither support nor oppose” response.)
Meanwhile, teacher opinion on the Common Core roughly parallels that of the public as a whole. Eighty-seven percent of teachers with an opinion supported the initiative in 2013. The biggest drop in teachers’ support for Common Core (33 percentage points) took place between 2013 and 2014. Teacher opinion slipped an additional 10 percentage points in 2015, but stabilized at 44% in 2016. If teacher opinion is stabilizing, it could give hope to Common Core supporters, provided that teachers, the specialists on education matters, are driving public opinion.
For several years EdNext has studied public response to the name “Common Core” as distinct from opinion about the general concept of uniform state standards. To do so, we have divided respondents into two equal and randomly selected groups, asking one group the above question and the other an otherwise identical question that refers to “standards that are the same” rather than to Common Core. Differences in the responses to the two questions reveal that the Common Core “brand” holds a negative connotation for many people: every year, support for using the same standards in general is higher than it is for Common Core in particular (see Figure 1b). In 2016, support for uniform standards climbs to two thirds when the Common Core label is not mentioned, as compared to an even split when the name is included. The brand name is particularly toxic to Republicans, who are 22 percentage points less likely to respond favorably when the name is mentioned (while Democrats are just 10 percentage points less likely to do so). Among those asked the question that does not mention Common Core, the 16-percentage-point drop between 2014 and 2015 has been followed by a recovery of 2 percentage points between 2015 and 2016, suggesting possible stabilization of opinion.
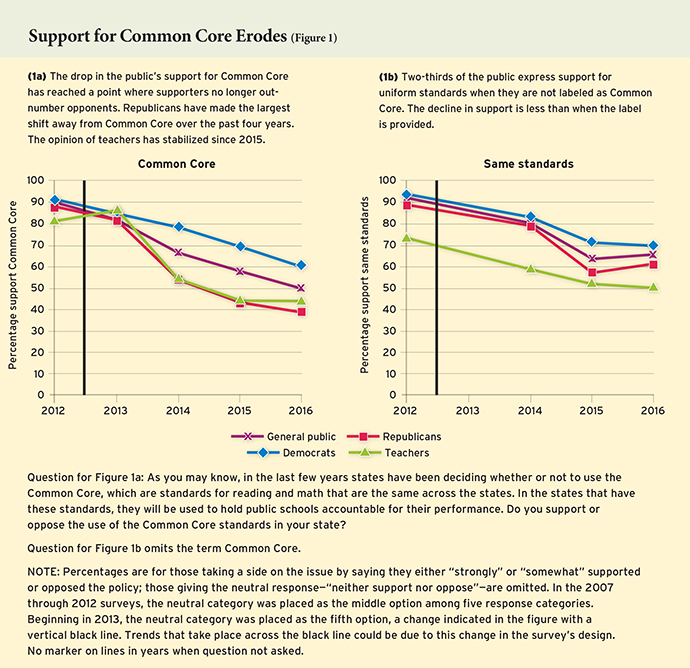
Teacher opinion is less influenced by the brand name. Even when the Common Core name is not mentioned, only 50% of teachers say they approve of uniform standards. That figure is only 6 percentage points higher than the 44% in favor when Common Core is mentioned. It seems that a substantial share of teachers either realize that similar standards and Common Core are much the same, or that they dislike standards in general.
Testing and parental opt-out. The public’s commitment to the use of standardized tests to assess students and schools has not declined. When people are asked whether the federal government should continue the requirement that all students be tested in math and reading in each grade from 3rd through 8th and at least once in high school, nearly four out of five respondents say they favor the policy (see Figure 2). The percentage of people who oppose letting parents opt their children out of state tests is almost as high: 70% come down against opt-out. Those percentages remain nearly as high as in 2015. Finally, support for using the same standardized tests across states is higher than support for the same standards. Seventy-three percent favor uniform tests, though support is slightly weaker among Republicans (68%) than Democrats (76%).
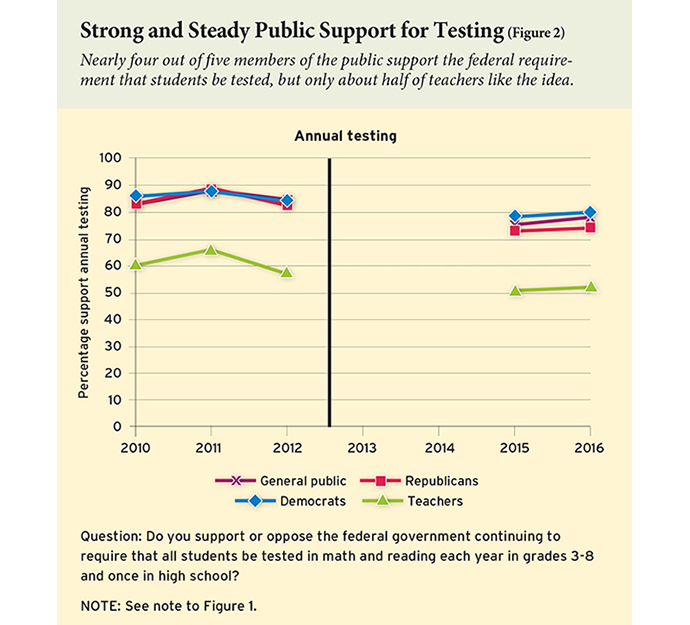
On these issues, teachers’ views again differ somewhat from the public’s. Only about half of teachers like the idea of continuing the federal requirement that all students in certain grades be tested. And, the percentage of teachers who think parents should be allowed to have their children opt out of tests increased from 36% to 43% between 2015 and 2016.
In short, one cannot summarily claim that people are turning against similar standards and tests throughout the United States. Even though they are not convinced that Common Core is the answer, they are still inclined to approve of the general idea of one framework for assessing students and schools across the states. This broader idea may well have a longer shelf life among the public—if perhaps not among teachers—than the Common Core brand.
Opinion on school choice issues is full of surprises for those who think that members of the public blindly follow their political leaders—or, for that matter, that elected officials hew closely to the views of their party’s base. Republican support for vouchers and tuition tax credits is slipping, creating a partisan cleavage in the electorate that is the opposite of the divide observed among Democratic and Republican elected officials. Opinion with respect to charter schools has also become more polarized, but here the growing opposition among Democrats parallels the intensifying resistance to charters by many state legislatures dominated by that party.
School vouchers have been heatedly debated across party lines for many years. The nation’s very first voucher program, begun in Milwaukee, Wisconsin, in 1990, was established at the behest of the Republican governor, Tommy Thompson. Democrats in the Wisconsin legislature frustrated the governor for several years, but Thompson enlisted the aid of Annette “Polly” Williams, a black state legislator who pulled together enough bipartisan support to get a very small program off the ground. The program has since expanded, but battles between Democrats and Republicans over its funding have never ceased. The conflicts in Wisconsin gave rise to a national organization, the Black Alliance for Educational Options (BAEO), which has cultivated a coalition of Republicans and black Democrats who support private school choice. Even so, votes cast by Democratic elected officials in support of voucher programs are rare. During the George W. Bush administration, Republicans initiated a small voucher program for low-income students in the District of Columbia. Upon his election, President Barack Obama made it clear that he opposed the program and attempted to starve it of funding, though Republicans in Congress have kept him from eliminating it altogether.
Among members of the public, the partisan divide runs in the opposite direction, with more Democrats than Republicans favoring school vouchers targeted toward low-income families, a fact that few analysts have recognized. However, a major shift against vouchers has taken place within the ranks of both political parties and among the public as a whole. Between 2012 and 2016, support for targeted vouchers, as indicated by responses to a question emphasizing the wider choice that vouchers offer to parents, fell from 55% to 43% among the public as a whole, from 58% to 49% among Democrats, and from 51% to 37% among Republicans (see Figure 3a). EdNext also traced opinions over a longer period of time, but with a question that emphasized “government funds” instead of “wider choice” (see sidebar on school vouchers). When this question was first posed in 2007, 56% favored vouchers for low-income families, but only 47% did so in 2013, and support slipped further, to 36%, in 2016. Taken together, these shifts are quite remarkable. Rarely does opinion on a policy question change so dramatically over the course of a single decade. When the “government funds” wording was used, Republican backing for targeted vouchers fell by 24 percentage points between 2007 and 2016: from 53% in 2007 to just 29% this year. Among Democrats, the decline was from 59% to 39%, a drop of 20 percentage points.
The popularity of vouchers for all families (universal vouchers) has also trended downward (see Figure 3b). In 2014, such vouchers were favored by 56% of the public; in 2016 it stands at just 50%. Fifty-one percent of Republicans favored them in 2014, but only 45% do in 2016. Meanwhile, Democratic support for universal vouchers has increased from 49% in 2013 to a level of 56% in 2016. Remarkably, Democrats in 2016 are 11 percentage points more supportive of universal vouchers than Republicans are.
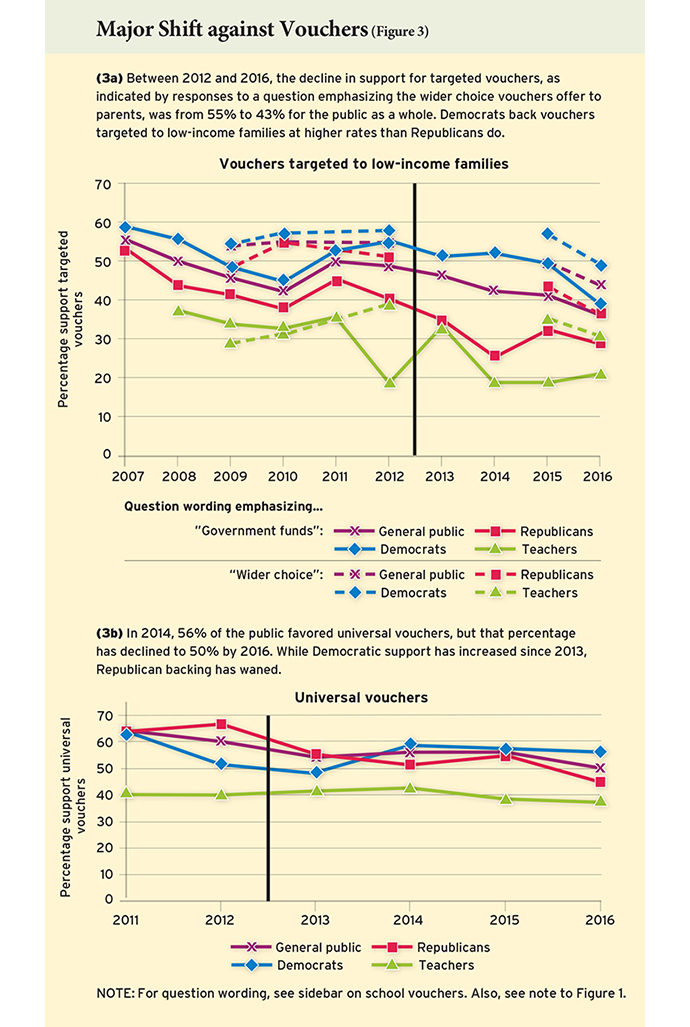
The greater support for vouchers among Democrats is all the more surprising, given the deepening opposition to them among teachers, whose support for targeted vouchers fell from 39% in 2012 to 30% in 2016 (when “wider choice” is emphasized in the question). The percentage of teachers favoring universal vouchers also slipped, from 42% in 2014 to 37% in 2016.
Any explanation for these trends is necessarily speculative. But the lower level of support among Republicans may reflect the tension between the party’s ideals and the material interests of its constituents. As conservatives, Republicans generally espouse the extension of free markets. Milton Friedman, an economist whose ideas have long been championed in Republican circles, made the case for vouchers as follows:
[School choice] would bring a healthy increase in the variety of educational institutions available and in competition among them. Private initiative and enterprise would quicken the pace of progress in this area as it has in so many others.
But many Republicans already have choice. Those who can afford to reside in affluent suburban areas can choose where they live and thus which schools their children will attend. Those without school-age children benefit from the higher value of homes in neighborhoods with higher-quality schools. Universal vouchers provide access to schools without regard to where people live, undermining the value of these homes. In small-town America, a Republican stronghold, local public schools are often major institutions that undergird cultural, sporting, and other community activities.
The focus of the school voucher movement has aggravated the tension between these material interests and conservative ideals. By making equal opportunity a central theme of the movement, organizations such as the BAEO, the Friedman Foundation (established by Milton and Rose Friedman and now known as EdChoice), Democrats for Education Reform, and other groups in favor of school choice have put Republican support at risk by emphasizing the role that vouchers can play in opening school doors to the disadvantaged.
On the other hand, this emphasis on equal opportunity holds appeal for racial and ethnic groups that comprise a significant part of the Democratic constituency. In 2015, the black and Hispanic populations were oversampled in the EdNext poll. At that time, nearly two-thirds of both blacks and Hispanics said they favored targeted vouchers. Even larger percentages of these groups supported universal vouchers. The large numbers of blacks and Hispanics who identify themselves as Democrats help explain the greater support for vouchers among Democrats than among Republicans. Indeed, it may be said that on this issue the Democratic Party is divided between two of its key constituencies—teachers on one side, minority groups on the other.
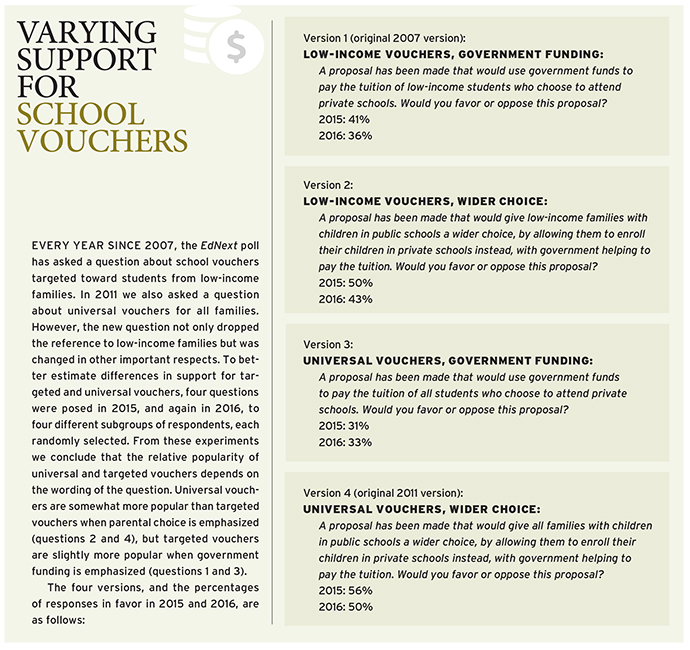
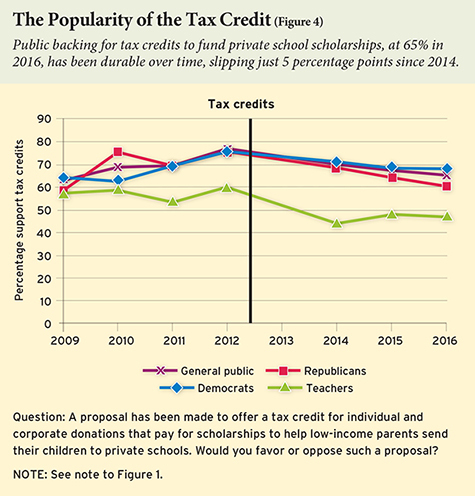 Tuition tax credits. Half of the states now have either a school-voucher program or a similar initiative that uses the tax code to subsidize the opportunity to attend a private school, according to EdChoice. A common form of tax credit allows businesses or individuals to contribute to organizations that distribute private-school scholarships to low-income families. Tax-credit initiatives are spreading more quickly than voucher programs, and a close look at the public opinion data suggests that is likely to continue. In four of its annual polls (2009 and 2014–16), EdNext has inquired about tax credits for scholarships for low-income families. In 2010 and 2011, we asked instead about “a tax credit for individual and corporate donations that pay for scholarships to help parents send their children to private schools,” language that implies the scholarships could be used by any family, regardless of income. However, the public responded to both programs in much the same way, so we shall ignore the distinction in the discussion that follows.
In 2016, 65% of people offering an opinion on tax credits say they favor them, making this mechanism the most popular kind of school choice (see Figure 4). Although substantial majorities support tax credits, the policy finds greater favor among Democrats, at 69%, than among Republicans, at 60%. Meanwhile, just 47% of teachers favor tax credits.
Support for tax credits may have reached its high-water mark in 2012 when the in-favor percentage climbed to 77%, well above the 63% level attained in 2009 when the tax credit question was first posed. It is not clear whether slippage has occurred since 2012, because the placement of the neutral response in 2013 was altered. However, we do see a modest decline in the percentage in favor, from 70% in 2014 to 65% in 2016. Much of the shift has taken place among Republicans, where backing for tax credits has slipped 8 percentage points since 2014. Nonetheless, tax credits have held on to greater public support, while both universal and targeted vouchers have not.
Charter schools. In 1988, when Ray Budde, a former assistant professor at the University of Massachusetts, Amherst, suggested that teachers bypass bureaucrats by forming their own schools, he was wise to apply the word “charter” to his concept. The term evokes images of the charters that granted Virginia to Sir Walter Raleigh, and Massachusetts Bay to the Pilgrims. It draws upon recollections of the Magna Carta, that ancient agreement between barons and the King of England celebrated as a pivotal moment in the history of freedom. Even Albert Shanker, president of the American Federation of Teachers, embraced the concept.
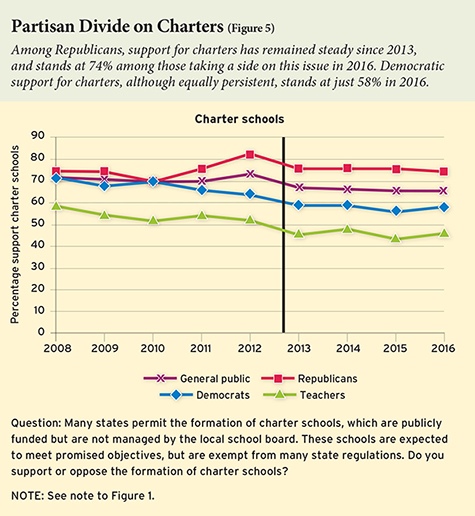 Charter schools have come a long way in the decades since Budde first proposed the idea. The first charter school was formed in Minnesota in 1992, and by 2007 charters were educating about 2% of the public school population nationwide. Today it is estimated that nearly 6% of public school students attend charters. Despite this growth, overall public opinion on charter schools has not changed much since 2008, when EdNext first inquired about them with the question it still uses (see Figure 5). Before 2013, support for charters ranged between 70% and 73%. From 2013 on, charter support has hovered between 67% and 65%. Despite this modest dip, we do not conclude that there has been any real change in public opinion, because the downward shift between 2012 and 2013 could simply have been a function of our moving the neutral response option in 2013 (see methodology sidebar).
Although public opinion is stable, support for charters is substantially greater among Republicans than among Democrats. Republican support for charters has remained steady throughout the decade, and in 2016 it stands at 74%. Democratic support for charters slipped from 72% in 2008 to 63% in 2012, but it has remained steady since 2013 at 59% that year and 58% in 2016.
Teacher Performance and Policies
 Teacher evaluations. Over the past five years, most states have overhauled their approach to teacher evaluation. Spurred by the Obama administration’s Race to the Top grant competition and later by its No Child Left Behind waiver program, states have adopted policies requiring that teachers be rated on ordered scales, and on multiple performance categories. (Previously, many school districts relied on binary rating systems in which all but a handful of teachers were deemed satisfactory.) These policy changes, however, have not transformed the results of teacher evaluations. In 2016, Matt Kraft of Brown University and Allison Gilmour of Vanderbilt studied the ratings teachers received from new evaluation systems in 19 states. In only three states did the fraction of teachers receiving an unsatisfactory or ineffective rating exceed 1%, and in not one state was it greater than 4%.
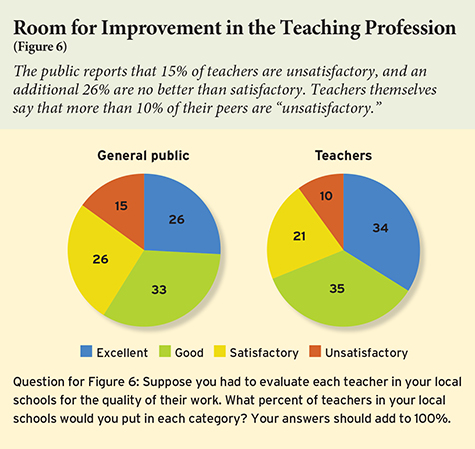
Do members of the public hold a similarly sanguine view of teachers? And how do teachers themselves rate their peers? We asked respondents in the 2016 EdNext survey to indicate the percentage of teachers in their local schools they would assign to each of four categories: unsatisfactory, satisfactory, good, and excellent. On average, the shares of teachers rated as good or excellent are 33% and 26%, respectively, with another 26% identified as satisfactory. But as Figure 6 illustrates, respondents report that they think 15% of teachers are unsatisfactory—far more than the maximum of 4% that were so deemed by the new state evaluation systems. Not surprisingly, teachers express somewhat more positive views of their colleagues’ performance than members of the general public do, but even they report that 10% of their fellow teachers are performing at an unsatisfactory level and that an additional 21% are no better than satisfactory. On average, they rate about half of the remaining teachers as good and half as excellent.
 Merit pay and tenure. In general, people broadly support merit pay and oppose teacher tenure. Asked their opinion on “basing part of the salaries of teachers on how much their students learn,” 60% express support (Figure 7a). The share of the public supporting merit pay has remained relatively constant since we first asked this question in 2008. Meanwhile, teachers remain largely united in opposition to the concept of merit pay, with just 20% expressing support. The gap of 40 percentage points in support between teachers and the broader public is the widest that we observe on any issue in our 2016 survey. Perhaps surprisingly, however, the views of Republicans and Democrats on merit pay are not that far apart, with 63% of Republicans in favor as compared to 57% of Democrats.
Asked about their support for “giving tenure to teachers,” just 31% of those offering an opinion express a favorable view (see Figure 7b). Support has declined by 10 percentage points since 2013, suggesting that opinion has shifted in response to the media attention the issue has received during the ongoing Vergara v. California litigation over the constitutionality of tenure (see “Reaping the Whirlwind,” legal beat, Fall 2016). The public’s opposition to tenure contrasts with 67% support among teachers themselves. There is also a noteworthy partisan gap in opinion on tenure, with 41% of Democrats and just 29% of Republicans expressing support.
The less satisfied respondents are with teacher quality, the more likely they are to support reforms to teacher-related policies. Those with generally favorable views of teachers—respondents who rate fewer than 25% of teachers as satisfactory or below—are evenly split on merit pay, with exactly 50% expressing support. In contrast, among those who think less highly of teacher performance—that is, respondents who rate at least three-quarters of teachers satisfactory or below—about 75% favor merit pay. A similar pattern emerges for teacher tenure, with 56% of the former group and 82% of the latter group expressing opposition.
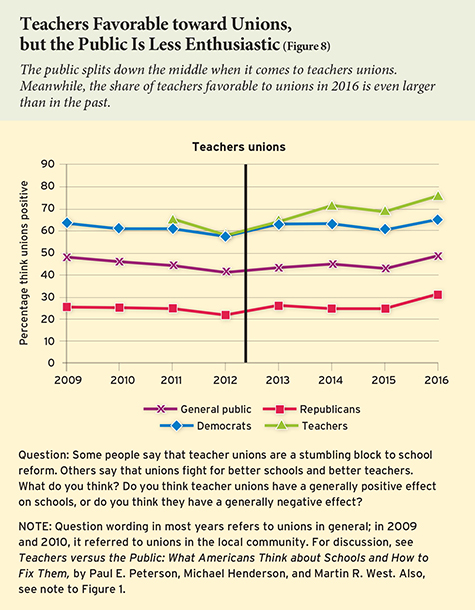 Teachers unions. Members of the public appear to be evenly divided in their thinking about the influence of teachers unions, with 49% of those who take a position saying they have a generally positive effect on schools (see Figure 8). Meanwhile, teachers overwhelmingly have favorable views of the unions that represent them, with 76% reporting that unions have a generally positive effect. Moreover, teachers’ views of their unions have trended in a more favorable direction since 2013, when just 64% gave a positive response. Predictably, Democratic and Republican views diverge, with 65% of the former and just 31% of the latter saying that unions have a positive effect on schools.
As the use of technology in schools grows rapidly—whether in blended-learning environments, for project-based learning, or just because it’s the fad du jour—the amount of time students should spend learning on computers is a point of contention. The chants of “teachers, not technology” and “laptops for layoffs” increasingly appear to be relics of the past, but more and more people seem to agree that digital learning in K–12 classrooms works best when it is used with the oversight of a teacher. They feel that students can learn effectively via computer if an educator is around to assist and supplement, and teachers are realizing that computers—when properly used—have the power to enhance their craft.
Yet blended learning has lost ground among parents over the last year. In 2015 and again in 2016 we asked: “About what share of instructional time in high school do you think students should spend receiving instruction independently through or on a computer?” Overall, the percentage of respondents who said that at least 30% of time should be spent in this way declined from 60% to 55% over the past year. Among parents, the change was from 57% in 2015 to 51% in 2016. Meanwhile, the percentage of teachers favoring a substantial amount of time devoted to computerized learning has remained constant: in 2015, 42%, and in 2016, 41% of teachers think at least 30% of students’ time should be spent receiving instruction on a computer.
Some blended-learning experts criticized our question wording in the 2015 EdNext survey that referred to “receiving instruction” rather than “learning independently.” To find out whether responses change when the wording is altered, we used the latter phrase in posing this question to a randomly selected subgroup of the respondents in 2016. For both parents and the public as a whole, the wording change made no significant difference. But for teachers, “learning independently” gathered more support than “receiving instruction”: 48% favor devoting 30% or more of the school day to learning independently, while, as mentioned, only 41% do when the question asked about “receiving instruction.”
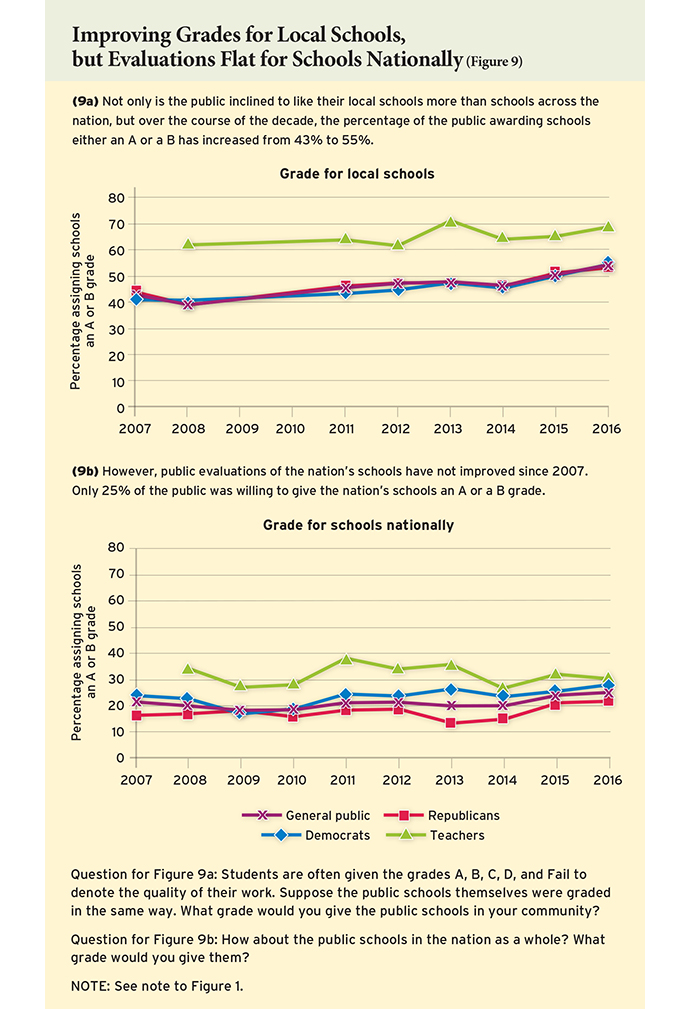
Each year since 2007, EdNext has asked people to evaluate public schools at both the national and the local levels on the A-to-F scale traditionally used to grade students. Respondents always give much higher grades to schools in their communities than to schools in the nation as a whole. When asked about local schools in 2016, for example, 55% of respondents give them either an A or a B and only 13% give them a D or an F, with the rest handing out the diplomatic C (see Figure 9a). But when grading the nation’s schools, only 25% of the respondents award them an A or a B, while 22% hand out either a D or an F (see Figure 9b). In short, local schools receive more than twice as many high grades as the nation’s schools do.
The much higher rating given to local schools creates a paradox. Simply by substituting the words “in your community” for the words “in the nation as a whole,” the survey generates a dramatically different set of evaluations. Since the nation’s schools are simply the sum of all the local schools in the country, and opinions in a nationally representative survey reflect attitudes toward local schools across the country, how can there be such a sharp difference?
In our view, people tend to rely on shortcuts when making assessments of public institutions, as they have neither the time nor the inclination to undertake full-scale, careful assessments of their own. For instance, people often prefer the familiar to the less well known and the proximate to the distant. In this case, citizens have some direct acquaintance with their local schools to which they or their friends and neighbors are sending their children, but the nation’s schools remain a distant abstraction about which they have little direct information.
What’s more, people tend to hear mostly good news about their community schools and almost all glum news about the nation’s schools in general. A Google search on “America’s schools” results in headlines such as “America’s Schools Are Falling Apart,” “Why America’s Schools Have a Money Problem,” and “The Real Reason America’s Schools Stink.” But a search for the term “local schools” turns up the websites of specific local school systems and a website rating “great schools.”
Accordingly, public evaluations of the nation’s schools have only slightly improved since 2007 among the public as a whole as well as among Republicans and Democrats. However, teacher thinking on this issue has slipped from a high of 38% giving schools one of the two top grades in 2011 to just 30% in 2016.
By contrast, people’s thinking about their own local schools has become noticeably more favorable since 2007. Not only are people inclined to like their local schools more than schools across the nation, but we see a clear upward trend in the percentage of the public awarding their schools either an A or a B. Over the course of the decade, the shift upward has been from 43% to 55%. Similar shifts over this same time period have taken place among both Republicans and Democrats. Teachers already offered a higher evaluation in 2008, but even from that high level there has been an upward shift of 8 percentage points to 69% of teachers giving local schools either an A or a B.
Grades assigned by the public to local schools have risen and fallen in the past. In the decade prior to the 1983 release of “A Nation at Risk,” the landmark report by the National Commission on Excellence in Education, the percentage of the public giving local schools one of the two highest grades in the Phi Delta Kappan (PDK) poll had fallen from nearly 50% to just above 30%. After the report appeared, stimulating a variety of reform efforts, public evaluations of their local schools climbed steadily to an all-time high of 51% in 2000, just prior to the national debate over the passage of the federal No Child Left Behind Act, which held schools accountable for low performance. At that point, public evaluations edged downward, with only about 44% willing to give their local schools an A or a B in the PDK poll, comparable to the 43% assigning schools one of these two grades in the EdNext poll of 2007. That year marked a new turning point, with evaluations of local schools rising once again in both the PDK and EdNext polls.
We do not have a ready explanation for the recent shift in public thinking in a positive direction. Certainly, there is nothing in the results of the National Assessment of Educational Progress (NAEP), commonly known as the nation’s report card, that justifies such optimism. Gains in 4th- and 8th-grade student performance registered during that period for whites, blacks, and Hispanics alike are far smaller than those notched over the prior decade, when public assessments of local schools were slipping. Also, performance of 15-year-old U.S. students on the Program for International Student Assessment (PISA) has shown no improvement since 2006. While student-achievement data run counter to rising public optimism, the change in public thinking corresponds with the new mood that emerged on Capitol Hill in 2015 when Congress passed the Every Student Succeeds Act (ESSA), which stripped the federal government of much of its authority to direct school reforms at the local level. Perhaps members of Congress heard from their constituents that they felt their local schools were good enough.
Racial Disparities in Discipline
In January 2014, the Obama administration’s Department of Justice and Department of Education jointly sent each school district a “Dear Colleague” letter urging local officials to avoid racial bias when suspending or expelling students. The letter said that African American students receive about 35% of one-time suspensions and about 36% of expulsions, even though they comprise only about 15% of those attending public schools. The departments, citing the Civil Rights Act of 1965, gave school districts new “guidance,” telling them they risked legal action even if their school-discipline policies were neutral on their face if those policies had an unintended “disparate impact, i.e., a disproportionate and unjustified effect on students of a particular race.” The issue has gained more traction throughout 2016, as discussions of disproportionately high incarceration rates among minority men have captured widespread media attention.
Do members of the public support policies that prevent disparities in suspensions and expulsions? And has the level of support changed over the past year? To find out, we asked respondents in both 2015 and 2016 whether they supported or opposed “federal policies that prevent schools from expelling or suspending black and Hispanic students at higher rates than other students.”
In 2015, only 29% said they favored a policy that prevented racial disparities in disciplinary policy, while 71% were opposed. Despite the debate over the past year, those percentages remain essentially unchanged in 2016—72% against, just 28% in favor.
Teachers are just as negative about federal attempts to eliminate racial disparities in disciplinary practices. In both 2015 and 2016, no fewer than 72% of teachers said they were opposed. Although opponents outnumber supporters in both political parties, one does see some polarization. Among Democrats, 61% say they do not favor the policy, as compared to 86% of Republicans.
There is some sign that the policy has lost ground even among African Americans. In 2015, 65% of black respondents expressed support for the idea, but that percentage fell to 48% in 2016. Among Hispanic respondents in 2016, 39% express support, about the same as one year ago.
It appears that the American people need a primer in school finance. A clear majority of respondents favor higher levels of per pupil expenditure and higher teacher salaries. But people tend to seriously underestimate both school expenditures and teacher pay. If respondents are told how much is actually being spent in their school district, they become less enthusiastic about increasing the amount; if they are told the average teacher salary in their state, they are less inclined to favor a pay raise. People also watch their pocketbooks more carefully in times of economic turndown, such as during the global recession of 2009. Once the economy begins to turn around, members of the public once again become more inclined to support spending increases for schools and salaries, but the pace at which this change occurs is sometimes slow and uneven. On all these financial questions, a wide partisan gap persists from year to year, and when it comes to teacher salaries, that gap seems to be widening.
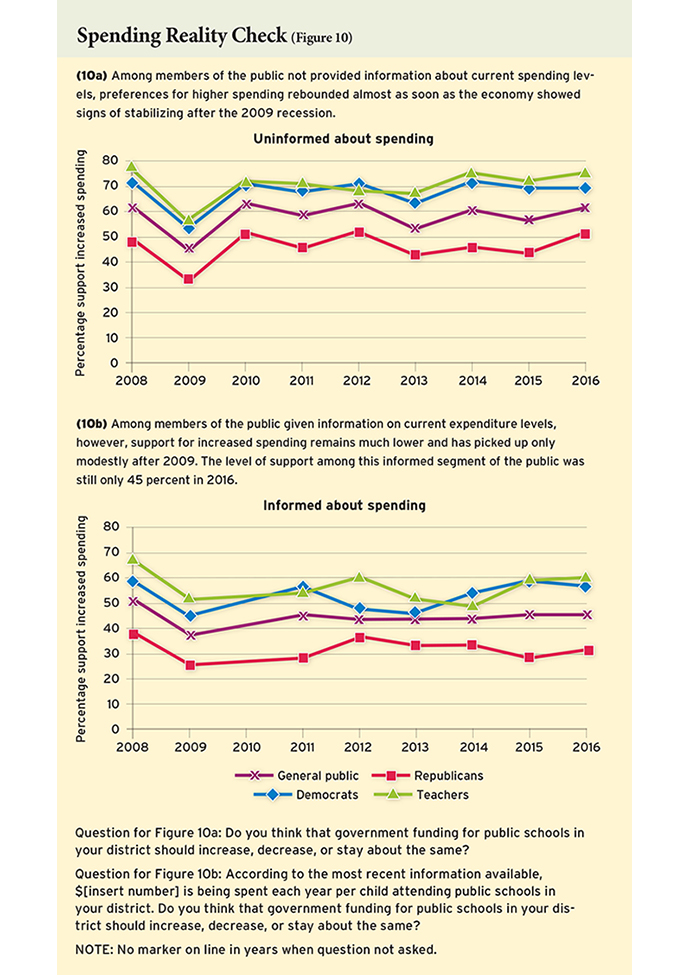
Current expenditures per pupil. As noted, people tend to underestimate the amount of money spent on public schools. When we asked respondents to estimate per pupil spending in their local school district, the average response in 2016 was $7,020, little more than 50% of the actual per pupil expenditure of $12,440, on average, in the districts in which respondents lived. That underestimation may color people’s thinking as to whether or not expenditures should go up. In 2016, when a random selection of respondents were asked if spending in their school district should be increased (as opposed to either being cut or remaining at current levels), 61% supported the idea (see Figure 10a). But in another random group, in which people were first told their district’s current level of school expenditure, only 45% favored an increment (see Figure 10b). Among Democrats, 70% of those not informed, but only 57% of the informed, want to spend more. A larger difference of 20 percentage points separates the uninformed (51%) and the informed respondents (31%) among Republicans. Information also influences teacher opinion. The difference between the uninformed and informed groups of teachers is 15 percentage points in the 2016 survey.
These findings are not unique to 2016. In every poll since 2007, we have found that respondents prefer to spend less when they are informed of current expenditure levels.
Differences between the uninformed and the informed are especially large in districts where expenditures per pupil are already high. Among respondents living in districts that spend more than $15,440 ($3,000 above the average district in the sample), 57% of the uninformed think spending should increase, compared to only 36% of informed respondents in these districts—a gap of 21 percentage points. Among respondents living in districts that spend less than $9,440 ($3,000 below the average district), 61% of uninformed respondents support higher spending, just 12 percentage points above such views among the uninformed. In sum, clear majorities of uninformed respondents want their districts to spend more, but when respondents are told current expenditure levels, they take those amounts into account—an indication that public thinking on expenditures would change if residents were better informed about actual fiscal practices in their schools.
Whether or not respondents are informed of actual spending, they seem to prefer lower expenditures when the country enters a serious recession, as happened from late 2007 to mid-2009. In 2009, support for increased spending fell sharply from 2008 levels. In subsequent years, preferences for higher spending revived for both the uninformed and the informed groups, but at different rates.
Among uninformed respondents, preferences for higher spending recovered almost as soon as the economy showed signs of stabilizing. As early as 2010, the percentage of this group favoring an increase rebounded to 63%, even higher than in 2008. Among informed respondents, in contrast, support for increased spending picked up only modestly after 2009, and the level of support in this group is still only 45% in 2016, noticeably below the 51% attained in 2008.
Since then, support among respondents who were not given spending information has bounced around at that level, with support fluctuating somewhat, depending on the year. In even-numbered years, when state and national elections are held, the share of the uninformed members of the public who favor higher spending is roughly 5 percentage points higher than it is in odd-numbered years, when most states do not hold elections. Is it possible that people come to think more spending is needed when expenditure levels are under debate in forthcoming elections? It is hard to say, because our data are collected in May and June of each year, when campaigns are only beginning to attract public attention. Still, no other explanation comes to mind for the small but regular seesaw in support for more spending among the uninformed respondents. The seesaw pattern is somewhat more pronounced among uninformed Republicans than uninformed Democrats, perhaps because Democrats are generally more committed to higher funding for education, while Republican thinking is more responsive to political and economic circumstances. About that one can only speculate. (The opinions of the informed respondents do not show a clear seesaw pattern.)
One can state with greater certainty that the partisan divide on this issue seems quite secure, running at 20 percentage points or more nearly every year among both those not informed and those informed of current expenditure levels. The fact that partisan differences persist even when people are given this information suggests that this rift in opinion runs deep within the electorate.
Teacher salaries. Just as per pupil spending is much higher than people think, so is the average teacher paid much better than members of the public estimate. When respondents were asked in 2016 to estimate the average teacher salary in their state, their guesses were, on average, 30% lower than the $57,000 average teacher pay reported by the National Education Association, the organization that collects the best available information on this topic.
Inasmuch as people, on average, think teacher salaries are quite low, it should come as no surprise to learn that a strong majority of respondents think they should rise. In 2016, when we asked a randomly selected subgroup of our respondents whether teacher salaries should increase, 65% favored the idea (see Figure 11a). But when members of another random subgroup were first told the average teacher salary in their state, only 41% wanted to hand out pay raises (see Figure 11b). The same pattern obtains among Democratic and Republican partisans. Seventy-six percent of uninformed Democrats wanted a salary increase but only 49% of the informed ones did. For Republicans, these percentages were 52% and 33%, respectively. Information even had its effects on teacher opinion. Eighty-nine percent of the uninformed teachers, but just 79% of the informed, favored a pay raise for themselves and their colleagues. These “information effects” on opinions about teacher salaries have been observed every year from 2008 to 2016.
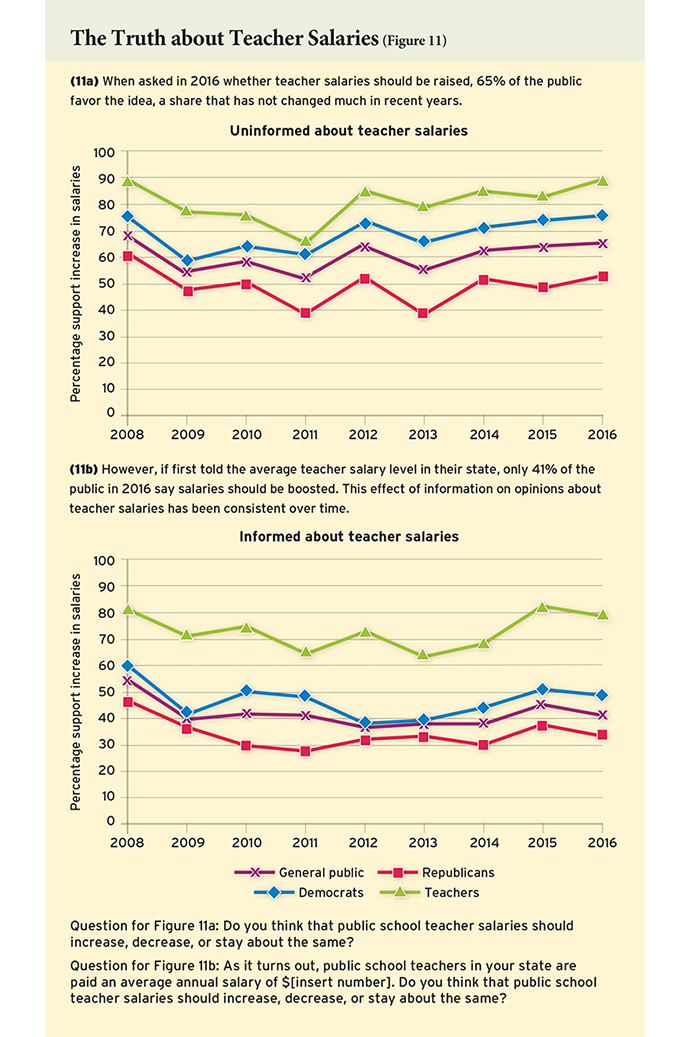
After the U.S. recession took hold in 2008, support for increases in teachers’ salaries among both uninformed and informed groups of respondents declined sharply. Among the uninformed, the share in favor of an increase fell by 14 percentage points in 2009 from a high of 69% attained in 2008. Among the group of people who were told current teacher salaries in their state, support fell from 54% to 40%.
Support for increases in teacher salaries has subsequently bounced back among both uninformed and informed respondents, but these rebounds have not followed the same course. Among uninformed respondents, the decline in support continued through 2011, but subsequently has recovered most of its lost ground, reaching the 65% level in 2016 mentioned above. In the intermittent years, we once again see a somewhat attenuated version of a seesaw pattern in the level of support depending on whether or not it is an election year. Once again, the seesaw pattern is greater among uninformed Republicans than uninformed Democrats. Also, the partisan gap among those uninformed of current salary levels persists, and in fact it seems to be growing. Democratic partisans are anywhere between 14 and 25 percentage points more supportive of higher teacher salaries than Republicans are, with the gap 10 percentage points wider in 2015 and 2016 than it had been in 2008 and 2009.
Among those who were told current teacher salaries in their state, support did not begin to increase again until 2014 and has never recovered to its 2008 levels, remaining just 41% in 2016. Meanwhile, the percentage of informed teachers favoring salary increases in 2016, at 79%, is nearly as high as it was in 2008 (81%). Note, however, that the teacher-public divide is widening. Between 2008 and 2016, support for increased funding has fallen by 13 percentage points among the informed public but by only 2 percentage points among informed teachers.
Conclusions
We draw seven main conclusions from our multiyear survey of public and teacher opinions on a broad range of educational issues:
1) Uniform national standards and tests of student performance against those standards gather broader public backing than do the specific sets of standards and tests known as the Common Core. In earlier polls, we found a similar diminution of support for federally mandated testing and accountability when that policy was translated into No Child Left Behind, a federal law that had numerous specific components. Even if members of the public buy into a broad principle, programs that operationalize that principle can suffer “death by a thousand cuts.”
2) A decade ago, school vouchers targeted toward low-income students commanded the backing of a substantial plurality of the public. That is no longer so, perhaps in part because targeted voucher programs remain small, fragile, and underfunded. Meanwhile, charter schools, appearing on the scene at roughly the same time, have expanded steadily, with 6% of the student population now attending one. Although public backing for charters is polarized along party lines, the level of support remains high overall, at nearly 2-to-1 margins. A more recent school-choice idea, tuition tax credits, could be at risk. While the concept remains popular with the public today, one wonders whether the current level of support will persist if tax credit programs don’t soon become more prevalent across the country.
3) People are less inclined to spend more when they find out how much is currently devoted to school spending. In nearly every year over the past decade (and in every year we have asked the relevant questions), we have found much less enthusiasm for boosting per pupil expenditures and teacher salaries among those who are first told how much these items are actually costing the district. We also find that people seriously underestimate how much is currently spent and how much teachers are paid.
4) People like their local schools more than ever before, but at the same time they judge a substantial share of the teaching force to be performing below a satisfactory level. Consistent with this view, as of today a substantial share of the public would end teacher tenure and pay more-effective teachers higher salaries than less-effective ones. However, one cannot be sure that public support for those tactics would be as great once a specific policy to enact them were put into place.
5) More than the public, teachers support higher salaries, embrace teacher tenure, oppose merit pay, and back the unions that represent many of them. They are also more likely to oppose most forms of school choice. Although teacher support for Common Core tumbled in 2014 and 2015, in the past year it has stabilized, with nearly half the teaching force continuing to support Common Core. Surprisingly, teachers believe that 1 out of every 10 of their colleagues is performing at an unsatisfactory level.
6) Members of the public do not favor the idea that expulsion and suspension rates in schools should necessarily be race neutral. Despite the wide disparities in expulsions and suspensions across racial groups, most people oppose policies that would require schools to suspend black and Hispanic students at the same rate as other students.
7) Both parents and the public as a whole remain
supportive of testing and opposed to policies that would allow parents to withhold their children from state test-taking, but support for parental opt-out has gained ground among teachers.
Paul E. Peterson is professor and director of the Program on Education Policy and Governance at the Harvard Kennedy School. Michael B. Henderson is an assistant professor at Louisiana State University’s Manship School of Mass Communication and director of its Public Policy Research Lab. Martin R. West, editor-in chief of Education Next, is associate professor at the Harvard Graduate School of Education and deputy director of the Program on Education Policy and Governance at the Harvard Kennedy School, where Samuel Barrows is a postdoctoral fellow.
The results presented here are based upon a nationally representative, stratified sample of adults (age 18 and older) and representative oversamples of the following subgroups: parents with school-age children living in their home (1,571) and teachers (609). Total sample size is 4,181. Respondents could elect to complete the survey in English or Spanish. Survey weights were employed to account for nonresponse and the oversampling of specific groups.
The survey was conducted from May 6 to June 13, 2016, by the polling firm Knowledge Networks (KN), a GfK company. KN maintains a nationally representative panel of adults (obtained via address-based sampling techniques) who agree to participate in a limited number of online surveys.
We report separately on the opinions of the public, teachers, parents, African Americans, and Hispanics, as well as on those of self-identified Democrats and Republicans. We define Democrats and Republicans to include respondents who say that they “lean” toward one party or the other. In the 2016 EdNext survey sample, 52% of respondents identify as Democrats and 44% as Republicans; the remaining 4% identify as independent, undecided, or affiliated with another party. These percentages are similar to those obtained in the first EdNext survey in 2007, when 53% identified as Democrats and 42% as Republicans. Nonetheless, any changes over time in the views of Democrats and Republicans may be driven by shifts in the composition of those who identify with each party.
In general, survey responses based on larger numbers of observations are more precise, that is, less prone to sampling variance than those made across groups with fewer numbers of observations. As a consequence, answers attributed to the national population are more precisely estimated than are those attributed to groups. The margin of error for binary responses given by the full sample in the EdNext survey is roughly 1.5 percentage points for questions on which opinion is evenly split. The specific number of respondents varies from question to question due to item nonresponse and to the fact that, in the cases of several items, we randomly divided the sample into multiple groups in order to examine the effect of variations in the way questions were posed. The exact wording of each question is displayed at www.educationnext.org/edfacts. Percentages reported in the figures and online tables do not always sum to 100 as a result of rounding to the nearest percentage point.
The EdNext survey often asks respondents to indicate whether they strongly support, somewhat support, somewhat oppose, or strongly oppose an idea or policy. They are also offered a fifth choice: “neither support nor oppose,” a category similar to (but not quite the same as) the “don’t know” category used by some other surveys.
In our previous reports on the poll, we have ordinarily provided information on 1) the combined percentages of those somewhat or strongly in favor, 2) the combined percentages of those strongly and somewhat opposed, and 3) the percentage taking the neutral position. That information is available in interactive graphics for 2015 and 2016 and in tabular form for all previous years at www.educationnext.org/edfacts/. In the figures and discussion presented in this essay, however, we disregard all the neutral-position responses and calculate the percentage favoring or opposing a policy as a proportion of only those taking a position on one side or another of the issue. Not much is lost by taking this step, and one definite benefit is obtained: one can capture the relative balance of support and opposition for any given year in a single number, allowing one to see how opinion is trending (or not) over time. But we caution the reader not to compare numbers from previous essays to those in our figures documenting trends, as the earlier numbers calculate support for a policy as a percentage of all respondents, including those taking the neutral position.
A further word of caution: In the 2007 through 2012 surveys, the neutral response was presented as the middle option among the five response categories. Beginning in 2013, the neutral response was made the fifth option, a change that reduces the number selecting that neutral alternative. In ignoring the neutral responses in our analysis, we assume that those selecting this category, if forced to choose, would distribute themselves in the same proportions as those actually taking a position. All trends that cross the 2012 boundary reflect this assumption, even when the proportion of neutral responses changes significantly. Therefore, these trends must be interpreted with care. In the figures, we drop a sharp vertical line through the graphs in order to remind the reader to use caution when interpreting trends that cross the time boundary. Our discussions in the text look at trends prior to 2013 separately from those after that date.
This article appeared in the Winter 2017 issue of Education Next. Suggested citation format:
Peterson, P.E., Henderson, M.B., West, M.R., and Barrows, S. (2017). Common Core Brand Taints Opinion on Standards: 2016 findings and 10-year trends from the EdNext Poll. Education Next, 17(1), 8-17.