Recent months have brought an ever-louder drumbeat in support of state-level participation in the Programme for International Student Assessment (PISA), with a weaker chorus calling for states to participate in the Trends in International Mathematics and Science Study (TIMSS). What would be gained if, in addition to the nation as a whole, individual states were to participate directly in these assessments by testing a much larger and more representative sample of students?
Not as much as many advocates would have us believe, and probably not enough to justify the considerable cost. Despite the growing infatuation with international comparisons of student performance and the illuminating feedback they can provide on how young Americans are doing relative to students in other countries, current international assessments cannot generate a great deal of reliable policy advice. In other words, they’re better at showing how our children’s academic performance (in certain subjects) compares with that of their overseas agemates than at guiding us toward stronger U.S. schools.
If states choose to spend a fortune on such tests, it’s because their leaders believe, in the words of the National Governors Association (NGA), that doing so will lead to “policy solutions to U.S. education system shortcomings.” This is the first of two justifications given for these efforts, which are widely referred to as “international benchmarking.” The second purpose is the straightforward comparison of U.S. students and their peers in other countries. Here, the resulting “league tables” are the center of attention, and these results are often described, and almost as often decried, as a “horse race” or an “Olympics contest” with an attendant fixation on who’s winning and who’s losing. Absent is an acknowledgment that these assessments embody particular assumptions and beliefs about what should be measured.
As states consider funding and administering international assessments for themselves, such facts must be kept in mind and key questions addressed. Among them are, what will states get as a result of participation? How much will it cost? Are there easier and cheaper ways of obtaining the desired information? We begin with a comparison of PISA and TIMSS, the two most prominent international assessments (see sidebar for additional information).
PISA v. TIMSS
PISA is a self-proclaimed “yield study” assessing the “literacy” of 15-year-olds and is not tied to any specific curricula. PISA claims to be assessing the skills young adults will need in the emerging global economy. Never modest, the report releasing the 2003 PISA results was titled “Learning for Tomorrow’s World” and the 2006 PISA results “Science Competencies for Tomorrow’s World.”
A Quick Guide to International Student Assessments
The three main programs are known widely by their acronyms:
- PIRLS (Progress in International Reading Literacy Study) is an assessment of 4th-grade reading administered every five years under the auspices of the International Association for the Evaluation of Educational Achievement (IEA). Fifty-five countries are expected to participate in 2011.http://nces.ed.gov/surveys/pirls/
- TIMSS (Trends in International Mathematics and Science Study) is IEA’s assessment of student achievement in 4th- and 8th-grade science and math and is conducted every four years. Some 67 countries administer TIMSS.http://nces.ed.gov/timss/
- PISA (Programme for International Student Assessment) is an evaluation of reading, math, and science “literacy” among 15-year-olds. The Organisation for Economic Co-operation and Development (OECD) conducts PISA every three years, emphasizing one of the subjects on a revolving basis. The emphasis in 2006 was science; in 2009 it will be reading. Participation in PISA has grown from 43 countries in 2000 to an expected 65 countries in 2009.http://nces.ed.gov/Surveys/PISA/
TIMSS is more grade- and curriculum-centered and far more modest in its claims. As described in the release of the 2007 data, “TIMSS is designed to align broadly with mathematics and science curricula in the participating countries. The results, therefore, suggest the degree to which students have learned mathematics and science concepts and skills likely to have been taught in school.”
PISA has not hesitated in making the most of these differences, and the high visibility of the Organisation for Economic Co-operation and Development (OECD) has ensured that PISA is the most prominent of the international assessments. Indeed, while in public the NGA is careful to say that it is in favor of international benchmarking in general and not in favor of any particular test, in practice the organization has tended to favor PISA. For example, a background paper the NGA released in February 2008 concludes by promising that “the National Governors Association will work with states interested in state-level PISA administration to identify available resources and cost-savings options to support state participation.” (In this three-page memo, TIMSS rated just one sentence.)
More recently, the NGA, the Council of Chief State School Officers, and Achieve released a report titled “Benchmarking for Success: Ensuring U.S. Students Receive a World-Class Education,” calling for state scores on international assessments. PISA was mentioned far more frequently than TIMSS, and the head of the PISA project at OECD, Andreas Schleicher, was repeatedly quoted.
The Alliance for Excellent Education has made an even stronger appeal for state participation in PISA, calling our failure to participate at that level “myopic.”
Most state interest is in the science and math assessments of PISA and TIMSS. In 1995, TIMSS participants included five states and one consortium of school districts. In 1999, just before PISA was launched, 13 states plus 14 consortia of school districts participated in TIMSS. Only two states, Massachusetts and Minnesota, funded their own participation in the 2007 TIMSS. No U.S. states have independently participated in PISA or PIRLS thus far.
The results of the three assessments are often compared to those of the National Assessment of Educational Progress (NAEP), which in the United States currently dwarfs the international assessments in scope. In 2007, the NAEP 8th-grade math exams involved more than 150,000 students in approximately 7,000 schools. The 8th-grade 2007 TIMSS assessed some 7,400 U.S. students in fewer than 250 schools. PISA in 2006 involved only 5,600 15-year-olds in around 170 schools.
The difference in size of these assessments is important: in reading and math in 4th and 8th grade, NAEP can report state-by-state performance every two years and, through the Trial Urban District Assessment program, NAEP can present data on a growing number of large school districts. In contrast, the small size of the PISA and TIMSS samples in most states makes state-level reporting difficult, though not impossible.
Statistical Benchmarking
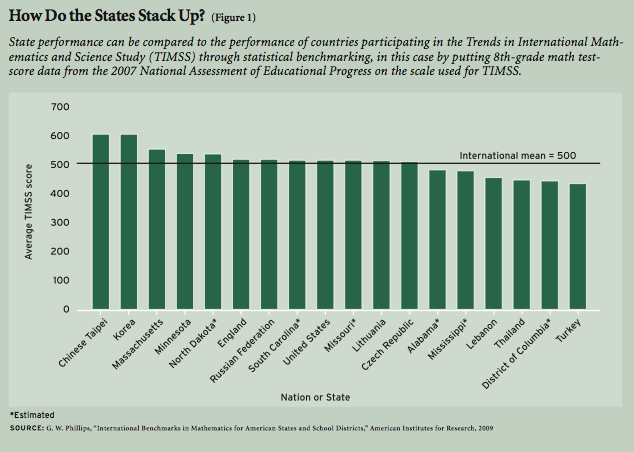
One relatively inexpensive way in which state performance can be gauged against international measures is through statistical linking. Figure 1 shows TIMSS scores for 8th-grade math for seven states plus the District of Columbia and an equal number of countries. This figure is based on work by Gary Phillips of the American Institutes for Research, who has estimated 2007 TIMSS scores for all states by placing TIMSS and NAEP on the same scale. Such statistical linking can be more easily done with TIMSS than with PISA because TIMSS is administered at the same grade levels as NAEP, and their purposes and frameworks are similar.
Figure 1 presents patterns more precisely than we might infer from NAEP or TIMSS alone. For example, we know from the 2007 NAEP math report that Massachusetts and Minnesota are high-performing states, that South Carolina and Missouri perform around the national average, that Mississippi and Alabama are low-performing states, and that the District of Columbia, is the lowest-performing “state” in the nation. The 2007 TIMSS ranks countries, ranging from the highest-performing, including Chinese Taipei (Taiwan) and the Republic of Korea, through the middle ranks, including the United States, and going down to the lowest-performing countries, including Turkey (the lowest shown in Figure 1), Syria, Egypt, Algeria, and Colombia.
By combining these two sets of results, we know that even the best-performing American states do not score nearly as high as Chinese Taipei or Korea, that the average-performing American states are about on par with England, the Russian Federation, and Lithuania, and that the District of Columbia’s performance is more comparable to those of Thailand and Turkey.
While the Phillips method creates this interwoven list at minimal cost (because he is estimating state scores from already extant data), obtaining actual state-level scores is very expensive. How much a more precise list would be worth is an issue that states must consider.
Generating Policy Advice
Figure 1 reflects the “how are we doing” aspect of benchmarking. But what policy advice can be garnered from these international studies? The quick answer is not as much as many would have you believe. This is particularly true of PISA, which is very aggressive in drawing policy implications out of the data. Reflecting the mission of the OECD, which combines both statistical and policy functions, the very organizational structure of PISA combines the collecting and release of statistical data with policy advice in a single unit. In contrast, in the United States, strict Office of Management and Budget guidelines separate the release of federal statistical reports by time and place from any policy statements.
The pressure from policymakers for advice based on PISA interacts with this unhealthy mix of policy and technical people. The technical experts make sure that the appropriate caveats are noted, but the warnings are all too often ignored by the needs of the policy arm of PISA. As a result, PISA reports often list the known problems with the data, but then the policy advice flows as though those problems didn’t exist. Consequently, some have argued that PISA has become a vehicle for policy advocacy in which advice is built on flimsy data and flawed analysis. Much of the critical work has come from Germany, where PISA has had a profound effect. There has also been debate in Finland, in part because students do well in PISA but did relatively poorly on TIMSS on 1999.
Among the limitations are the fact that both PISA and TIMSS produce cross-sectional (single point in time) data and therefore do not allow longitudinal analysis (comparisons over time) at the student level, which is how researchers prefer to measure growth in student achievement and to identify the factors associated with such changes. But too often, countries and education ministers demand information and don’t want to know how cross-sectional data using flawed measures can lead to bad advice or advice that seems “right” but has little or no basis in fact.
To be sure, international data can in some cases be useful for addressing some policy questions, and often these data are the only way to examine the consequences of differences in policy that vary across countries. But the obstacles to drawing strong causal inferences based on such data are substantial. While both the International Association for the Evaluation of Educational Achievement (IEA) and the OECD work hard to make sure that measures are comparable, there are large variations in how people in different countries understand similar questions, and how statistical agencies measure and report indicators. This is especially true for the United States, where, as a federal system of continental size in which education is still predominantly a state and local function, variance is often more important than the mean national value calculated by many international studies. Unfortunately, both TIMSS and PISA data are used, too often with little regard for their limitations, to formulate policy recommendations.
It should be noted that NAEP has taken a different approach to releasing its results, one that PISA has rejected. While early NAEP reports resembled the current voluminous PISA reports, over time, the Nation’s Report Cards have become shorter and more tightly focused on data that show cross-sectional results by state and by reporting categories called for in U.S. legislation (for example, race or ethnicity and income). NAEP reports also compare the performance of students at the same grade level over time; these comparisons have become a critical tool for measuring the nation’s progress. In short, these are highly focused and valuable benchmarking reports. Further, a typical NAEP release is far more accessible to policymakers, reporters, and the general public than PISA reports are. And NAEP reports do not contain policy implications or recommendations: the dividing line between statistical reporting and policy prescription is honored.
Within guidelines designed to protect confidentiality, data from all three assessments are made widely available both online and through other avenues of dissemination, allowing researchers to explore statistical patterns and the policy implications of the data. However, with PISA, the OECD megaphone attracts the attention of policymakers and drowns out alternate interpretations.
Accountability Problem
OECD is a high-level intergovernmental organization with wide sweep across many domains, including finance, trade, environment, agriculture, technology, and taxation as well as education. Its pronouncements have a gravitas that cannot be matched by the IEA. Just as OECD does not have a modest presence in describing the scope of PISA, its voice in pushing the policy lessons that can be “learned” from PISA has been equally loud. But that loud voice has a few cracks in it.
For example, consider Chapter 5 of the 2006 PISA report, “Science Competencies for Tomorrow’s World,” which is devoted to analyzing the effects of school resources on student performance. Clearly, the stakes are high in identifying the best ways to allocate money, teachers, school leadership, and the like. Box 5.1 on page 215 notes all the appropriate caveats: PISA is cross-sectional; some things are not measured well; and other important factors are unmeasured. Moreover, it notes that the school characteristics measured are from the student’s current school, and in many countries a 15-year-old might have been in that school for only a year or two. The report warns that “these restrictions limit the ability of PISA to provide direct statistical estimates of the effects of school resources on educational outcomes.”
Nonetheless, the chapter proceeds with dozens of charts and tables relating different school resources to student outcomes. Finally, the chapter ends with “policy implications,” even though the foundations for these implications are weak. For example, the report reads, “what is noticeable about the strongest effects measured in this chapter is that they are not the ones most closely associated with finite material resources, such as the distribution of good teachers. Rather, such effects are related to how schools and the school system are run—for example, the amount of time that students spend in class and the extent to which schools are accountable for results.”
This is powerful stuff: hold schools accountable, and other issues (such as the allocation of good teachers) don’t matter. What is the evidence for PISA’s confident endorsement of accountability?
On close examination, “accountability” turns out to mean merely the public posting of school-level results. No other measures of accountability were tied to PISA scores at a level of statistical significance once students’ socioeconomic status was introduced. But the report uses the highly evocative word “accountable” rather than “posting.” The reader can easily have the mistaken impression that a broad set of conditions has been found to be important.
Standards of evidence and the research practices that are found in this analysis would not pass muster in the equivalent statistical agencies and among most researchers in the United States. Indeed, the National Center for Education Statistics (NCES) frequently objects to many of the findings in PISA reports, but is almost as often politely (and sometimes not politely) ignored.
Questions Remain
Despite these limits, the chorus for state-level assessments will continue to grow louder. But how would state-level international assessments fit into the already complex world of large-scale assessments? In the 2006 PISA assessment, the U.S. barely made the minimal school participation rate to be included in the analysis. If governors and chief state school officers are behind a state administration of PISA or TIMSS, getting school participation may be easier, but student engagement in low-stakes tests declines as students get older—likely a situation that even gubernatorial exhortations cannot resolve.
If it is true that what gets tested gets taught, are governors and chief state school officers really willing to allow OECD or IEA to drive their curricula? In the rush to employ rigorous international standards, we need to keep in mind that TIMSS and PISA each embody particular views about what those standards should be.
Can PISA really inform a state’s policymakers about how to improve their school system? PISA assesses mathematical and science “literacy,” a broad domain encompassing skills and knowledge learned both inside and outside of school. PISA 2006 cautions, “If a country’s scale scores in reading, scientific or mathematical literacy are significantly higher than those in another country, it cannot automatically be inferred that the schools or particular parts of the education system in the first country are more effective than those in the second. However, one can legitimately conclude that the cumulative impact of learning experiences in the first country, starting in early childhood and up to the age of 15 and embracing experiences both in school and at home, have resulted in higher outcomes in the literacy domains that PISA measures.” In other words, PISA itself admits that it cannot reliably identify which parts of the education pipeline are working well and which need improvement.
How expensive are these tests, and are there less costly ways to get these or similar data? To get a state-level score, about 1,500 students in the state need to be tested. The cost to test that number of students is around $700,000 for PISA and, based on the experience of Massachusetts, approximately $500,000 per grade for TIMSS. Nationwide, that’s around $25 million per PISA assessment and $15 million per grade in TIMSS if all states participated. There are less expensive alternatives, such as the TIMSS estimates for the states generated by Gary Phillips and noted earlier. While the alternatives would not produce all the details that might come from the full assessment (and mercifully avoid the temptation to use these data for unwarranted policy analysis), they could produce reliable estimates of state performance relative to international performance. Phillips has recently worked out the technical details for obtaining international benchmarks with PISA, by embedding PISA items within the state assessment. The PISA items on the state assessment are then used to link the state assessment to the PISA scale. Once this is done, the state can benchmark its performance against PISA without having students take the entire PISA assessment.
An alternative to statistical linking for PISA would be “small area estimation.” These estimates are model-based and “borrow” information from other data available for the state together with any state-level PISA data collected. The results are known as “indirect” projections to distinguish them from standard or “direct” estimates. NCES produced such state and country estimates of adults with low literacy based on the National Assessment of Adult Literacy (NAAL), for example. Further research would be needed to determine the feasibility of conducting small area estimates to generate state-level PISA scores. And it is likely that the PISA sample would have to be increased somewhat. This would add costs, but far less than full state-level assessments.
Double-Edged Sword
Compared to students in most other OECD countries, American students do not perform well on PISA. In the aftermath of the dismal results from the 2006 PISA, the clamor for producing state-level PISA scores was thunderous. State interest in administering PISA has since receded, with the current financial crisis and the fading of the fanfare surrounding PISA 2006, but the economy will eventually turn around, PISA 2009 is in the offing, and the Obama administration and many governors are sympathetic to the idea of international benchmarking.
While TIMSS has its partisans and states have chosen to participate in past years, momentum is behind PISA. If more states do choose to participate in PISA, what should they expect? First, they would get a PISA score that would allow them to compare themselves to other PISA participants. In some cases, this would provide bragging rights (“Our students are better than those in Turkey”). In most states, disappointing results would provide reform-minded governors with ammunition to push for their own legislative agenda. But if states choose a full state assessment, along with the PISA scale score would come all of the OECD’s policy advice and its approach to standards, which might make it harder for reform-minded governors to choose the options they prefer. Caveat emptor.
Mark Schneider is a vice president at American Institutes for Research and former commissioner of the National Center for Education Statistics.