During the 1999-2000 school year, the private Children’s Scholarship Fund (CSF) offered partial scholarships to low-income students in Charlotte, North Carolina. The partial scholarships defrayed up to $1,700 in tuition expenses at the private elementary or secondary school of a family’s choosing. Scholarships were awarded by lottery to families who went through an application process, because not enough funds were available to provide them to all the interested families.
The awarding of scholarships by lottery created a rare opportunity in educational research: a field experiment in which students were assigned randomly to both public and private schools, thus allowing me to test the effects of receiving a voucher and, more generally, to compare the performance of public and private schools. The study used both standardized test scores and surveys of parents and students to evaluate the effect of the scholarship program on both academic performance and student and parental satisfaction.
Data
Only students enrolled in grades 2 through 8 were tested for this study. These students fell into three categories: 1) those who won a scholarship and used it to enroll in a private school (“choice students”); 2) those who won a scholarship but either moved out of the area or elected to remain in a public school for a variety of reasons (“noncomplying students”); and 3) those who didn’t win a scholarship (“control students”).
Overall, 388 students used a scholarship to enroll in private school; 413 students won the lottery but did not enroll in private school; and 342 students didn’t win a scholarship. Near the end of the 1999-2000 academic year, all of these students and their parents were invited to attend testing sessions where parents completed surveys while students took the Iowa Test of Basic Skills (ITBS) survey version. Students in grades 4 through 8 also completed a survey. Of the 1,143 students who were sent invitations to attend a testing session, 452, or 40 percent, participated in the study (within the three groups, 53 percent of the choice students, 20 percent of the noncomplying students, and 49 percent of the control students participated in the study).
 |
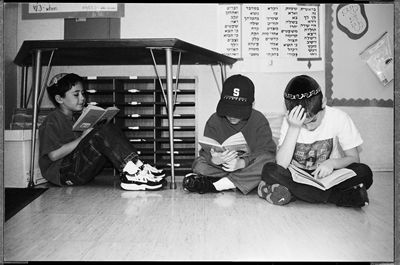
| Most of the private schools at which students used the scholarships operate with less than half as much per-pupil spending as the public schools.
|
Even as favorable a research design as a lottery is susceptible to the problems of nonparticipation and noncompliance. If students with similar demographic characteristics drop out of the study in large enough numbers, they can upset the balance between the experimental and control groups, rendering them less comparable. But my data show that the incomes of the participating and nonparticipating families were roughly equal for both the lottery winners and losers, as well as for the choice, control, and noncomplying students. In other words, while those who participated in my study differed somewhat from those who did not, the differences don’t appear to have biased the comparability of the groups.
My primary interest lies in identifying the effect of using a scholarship to attend private school, not the effect of a student’s being offered a scholarship but not using it. I therefore want to compare the choice students, the students who used a scholarship to attend private school, with the control and noncomplying students, the two groups who entered the lottery but ultimately stayed in public schools. Overall, the choice students and the comparison groups were quite similar in their demographic characteristics, though clearly not identical. The test-score data were adjusted statistically to account for any observed differences between the two groups, such as level of family income-an important predictor of academic performance-that might have biased the results. In calculating the results, I controlled for a host of background characteristics, including the mother’s educational level, her race, the student’s family income, whether a student lived in a two-parent household, and the student’s sex.
Concern about the unobserved differences between families who send their children to public and private schools has always limited scholars’ ability to draw conclusions from evaluations of public- and private-school performance. Even after adjusting for observed demographic differences, researchers always wondered whether unobserved differences that were not being accounted for, such as parental motivation or the intellectual richness of home life, played a larger role than the schools themselves in causing differences in academic performance between public and private schools.
In this case, however, the application process and lottery have produced comparison groups that are already quite similar on observed as well as (in all likelihood) unobserved characteristics. All families were motivated enough to complete an application for a scholarship. Only low-income families were eligible for a scholarship. A lottery was used to select which students would be offered scholarships, creating, as the statistical analysis has confirmed, two groups that were nearly identical. While noncompliance and nonparticipation have created differences between the two groups, they are similar enough that adjusting for observed characteristics is likely to produce highly reliable results.
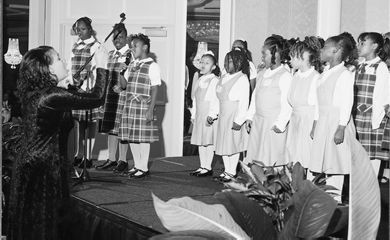
| A lottery was used to select which students would be offered scholarships, creating, as the statistical analysis has confirmed, two groups that were nearly identical. |
Results
After one year, the results show that students who used a scholarship to attend a private school scored 5.9 percentile points higher on the math section of the ITBS than comparable students who remained in public schools. Choice students scored 6.5 percentile points higher than their public school counterparts in reading after one year (see Figure 1).

Using a statistical technique known as instrumental analysis to adjust for the potential bias of noncompliance yields results that remain strong and positive. The results of this analysis show that, after only one year’s time, attending a private-school improved student performance on standardized tests in math and reading by between 5.4 and 7.7 percentile points.
On average, a scholarship raised students from the 30th percentile to the 37th percentile. This is a fairly large gain approximately 0.25 standard deviation in math and reading. To put this gain in perspective, the difference nationwide between minority and white students is approximately 1.0 standard deviation. The benefits of the Charlotte CSF program are roughly one-quarter as large at the end of only one year.
Another important measure of the scholarship program’s performance is parental opinion. While the desire to affirm their decision may distort parents’ judgment, their intimate knowledge of (and interest in) their children’s well-being puts them in a good position to assess the benefit of a particular program. Our survey asked parents to assign their child’s school a letter grade, A through F. Nearly twice as many choice parents gave their child’s school an A (53 percent) as did public-school parents (26 percent). Choice parents were also far more likely to report being “very satisfied” with virtually all aspects of their children’s school: its safety, teacher quality, class size, clarity of school goals, teaching moral values, academic quality, teachers’ respect for students, and so on (see Figure 2).
Surveys of students in grades 4 through 8 found much higher levels of satisfaction among choice students than among public-school students. Roughly 40 percent of choice students gave their private school an A, compared with 32 percent of public- school students. Responding to a question asking how they feel about going to school each day, 24 percent of the public-school students said they didn’t want to go, compared with 9 percent of private- school students. And 24 percent of nonscholarship students said they didn’t feel safe at school, compared with 9 percent of choice students (see Figure 2).
Parental reports confirmed their children’s perceptions about safety at school. More than a third of public-school parents reported problems with fighting in school (36 percent), compared with 16 percent of choice parents. One-quarter of public-school parents reported problems with racial conflict, compared with 12 percent of choice parents. Of public-school parents, 22 percent reported problems with guns or weapons at their children’s elementary schools, compared with 11 percent of choice parents. Keep in mind that none of these children is beyond 8th grade.
School Facilities and Services
Rising test scores and high levels of parental and student satisfaction indicate more-luxurious private schools with better resources, right? Far from it. Most of the private schools at which students used the CSF scholarships operate with less than half as much per-pupil spending as the public schools. Tuition at most of the private schools is less than $3,000. Additional fundraising brings no more than a few hundred dollars per student.
The private schools actually offer sparser facilities and fewer services than the public schools. For example, only 70 percent of choice parents reported their school’s having a library, compared with 90 percent of public-school parents. Only 63 percent of choice parents said their school had a gym, compared with 91 percent of public-school parents. In terms of services, only 18 percent of choice parents said that a program for students learning to speak English was made available to them, compared with 50 percent of public-school parents. Only 49 percent of choice parents reported a program for learning disabilities being available, compared with 71 percent of public-school parents. Only 51 percent of choice parents reported that their school had a program for gifted students, compared with 72 percent of public-school parents. Choice parents were also less likely to report the existence of a counselor, a nurse, a music program, an art program, or prepared lunches at their schools.
Some amenities were equally or more available at the private schools. Private and public schools were equally likely to have a computer lab. And the private schools were equally likely to offer individual tutors and more likely to offer after-school programs. When parents report that they are more satisfied with the private-school facilities, they clearly must be focusing on the features they deem most important. Private schools appear to have far fewer resources, but they concentrate those resources on providing the facilities and services that parents value most.
Making Money Matter
Why do parents like these poorly funded, amenity-starved schools so much? What might account for the improvement in their children’s academic performance? While this study was not designed to address these questions fully, I can speculate based on the data I collected. Some of the most important differences between the private and the public schools pertain to the quality and motivation of their teachers. Parents gave high marks to the quality of instruction at the private schools. So, too, did the students. Choice students are almost twice as likely to report that their teachers are “interested in students” as are public-school students. Choice students are also significantly more likely to report that their teachers listen to them, that teachers are fair, and that students get along with teachers.
Despite having less money for salaries and benefits, private schools appear to be better able to recruit quality teachers and to dismiss poor ones. They may attract higher quality teachers because they can offer positive working conditions, an organization with a clear sense of mission, and greater autonomy in the classroom. The ability of public schools to offer such perks is hampered by layers of bureaucratic regulations and management, an unfortunate by-product of political governance. Teacher union and school district rules also make the removal of poor teachers much more difficult in public than in private schools.
The private and public schools in the study also differ in the size of their student populations and average class size. The median choice student is enrolled in a school that has between 151 and 300 students. The median public-school student attends a school with between 451 and 600 students. The median choice student sits in a class with between 11 and 15 students, while the median public-school student is in a class with between 21 and 25 students. Educational researchers are increasingly recognizing that smaller districts, schools, and perhaps classes seem to improve student performance and satisfaction. Smallness may encourage the development of a sense of community and common purpose, possible keys to school success. And smallness obviates the need for rigid rules that restrict the autonomy of principals and teachers.
Some critics of school choice have suggested that small classes in private schools “explain” the achievement benefits of private-school scholarships and voucher programs. If public schools had the additional resources necessary to reduce class size, so the thinking goes, they too would raise student performance. This, of course, begs the question: Why are private schools, despite having far fewer resources, able to provide significantly smaller classes than public schools? And what assurance is there that additional funds for public schools will lead to reduced class sizes-and not to higher salaries or more non-teaching staff?
Nevertheless, class size, when factored into my analysis, was not significantly related to student achievement. In other words, class size did not “explain” the achievement benefits of receiving a scholarship to attend private school in Charlotte.
 |
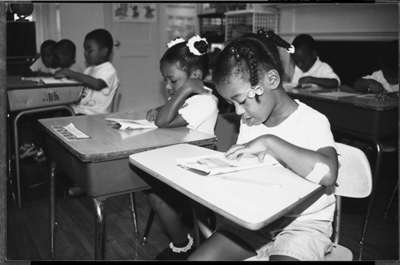
| There was little evidence to suggest that private schools were creaming the best students or dumping the worst.
|
Creaming and Dumping
Another oft-heard excuse for the success of private schools is that they are able to select their students by accepting the finest students (or creaming) and dumping the undesirable ones.
In my sample, there was little evidence suggesting that private schools were creaming the best students or dumping the worst. First, hardly any private schools asked applicants to take an admissions test. Of those families who were unable to place their children in the schools of their choice, more than three-fifths cited as the main obstacle the financial constraint of having to bridge the gap between the $1,700 scholarship and the full tuition. Parental reports indicate that an admissions test prevented only two of the lottery winners from attending their chosen private school.
Second, there is no evidence that private schools expelled undesirable students or asked them not to return. Any choice parents whose children switched schools during the academic year were asked why they left their original private schools. None reported that they switched schools because their children were expelled. Of those parents who were in doubt as to whether they would return to the same school next year, none reported that their children were asked not to return. In short, there is virtually no evidence that the choice schools academically screened their students for admission or expelled-or “counseled out”-students they found undesirable.
Parents were also asked whether their children had any physical handicaps, learning disabilities, or difficulty learning to speak English. Very few reported physical handicaps-only 3 percent of choice parents and 2 percent of public-school parents. Similarly low percentages of choice and public-school parents reported that English was not their children’s native language. However, choice parents reported fewer children with learning disabilities (4 percent) than public-school parents (13 percent) reported. Given their lower levels of funding, fewer private schools offer special programs for learning disabilities. The disparity also may be explained by differing incentives to label children “learning disabled.” Public schools receive additional resources for students labeled learning disabled, and they may be able to exempt learning disabled students from accountability testing.
| Despite having less money for salaries and benefits, private schools appear to be better able to recruit quality teachers and to dismiss poor ones. |
The higher share of learning disabled children in public schools also may be evidence of mere parental choice. Parents of children with special needs are more likely to choose schools that have the funds to offer special programs. A fair test of whether private schools are avoiding learning disabled students would compare the rates of learning disabilities when private schools are given the same additional resources to serve those children that public schools receive. Otherwise, the evidence on learning disability rates is ambiguous.
In general, students who used their scholarships to enroll in a private school were more likely to be minority and considerably less advantaged than the typical Charlotte student. Three-quarters of the choice students were African-American, compared with a little more than a third of all students in the Charlotte-Mecklenburg school district. As of 1990, the average family income in Charlotte was nearly $34,000, almost $10,000 more than the average family income of choice students ten years later. In 1999, 32 percent of choice families reported receiving some kind of public assistance, such as food stamps or welfare; only 5 percent of Charlotte households were on public assistance in 1990. Even after their first year in private school, choice students were still scoring well below the national average on standardized tests (although they were scoring significantly better than they would have had they not received a scholarship). It is clear that private schools are accepting the challenge of educating these disadvantaged students, not creaming off the best or dumping the worst.
The Next Level
It is important to understand that the privately funded scholarship program in Charlotte departs from a model, publicly funded, school choice program in a number of ways. First, the $1,700 scholarship always required a significant supplement from the family to meet the tuition expense. A voucher that is set at the level of per-pupil spending in the local school district is likely to cover the full cost of tuition at most private schools. This may alter the results we would expect to see from gaining access to private schools. The infusion of cash that a publicly funded voucher would provide to private schools might make them even more effective. But easing the financial burdens that families face might attract more lower-income and less-motivated parents who might act as a drag on test-score improvements.
Second, privately funded scholarships place little or no regulation on the activities of private schools. By contrast, publicly funded vouchers are likely to carry a variety of curbs that might distract private schools from their core mission and tie up resources that would otherwise have gone to instruction. In the end, however, the regulations might also improve the program by ensuring equal access and by requiring that schools provide accurate information on student performance and faculty qualifications.
Third, there was enough spare capacity in existing private schools to accommodate the small number of CSF scholarship winners. A larger, publicly funded school choice program would require the creation of new private schools. These schools might be better or worse than existing private schools.
There is no way to address these issues fully without expanding the number and scale of publicly funded voucher programs. There is now a body of evidence on the effects of school choice: the positive findings from Charlotte comport with the positive results of privately funded programs in New York; Washington, D.C.; and Dayton, as well as pilot voucher programs in Milwaukee and Cleveland. It is not yet clear whether these results will translate to a broader scale. But the existing evidence is encouraging enough to justify trying.
-Jay P. Greene is a senior fellow at the Manhattan Institute for Policy Research. To view his study in its entirety, log on to www.edmattersmore.org.