There’s no denying political climate change. The past 18 months have seen an enormous swing in the Washington power balance, a shift that has heightened the polarization that has characterized our public life for more than a decade now. How has this divisive political climate influenced public opinion on education policy and reform? And how much, if at all, has the new president swayed the public’s views?
The 2017 Education Next survey, conducted in May and June of this year, offers us an opportunity to explore these questions and many more. With this year’s survey, our 11th annual poll of a representative sample of the American public, we examine current attitudes toward major issues in K–12 education and compare the results with those of prior years. We also break down responses by political party and, for whites, by level of education. These analyses allow us to see whether changes have been concentrated in any specific political or demographic group.
Our sample of more than 4,200 respondents, including oversamples of parents and teachers, also gives us the chance to experiment with some of the survey questions in order to tease out nuances in public opinion. For a variety of questions, we divided our respondents randomly into two (or more) groups and asked each group a slightly different version of the same question. For example, we told one group about President Donald J. Trump’s position on an issue while the other group was not given this information. By comparing the responses of the two groups, we are able to estimate the “Trump effect” on public thinking. Since we performed this same experiment during the first two years of the Obama administration, we are able to compare the Trump impact with the Obama one.
This report covers 10 main topics. Some of the key findings are:
1. School Choice. Public support for charter schools has fallen by 12 percentage points, with similar drops evident among both self-described Republicans and self-described Democrats. Meanwhile, opposition to school vouchers and tax credits to fund private-school scholarships has declined.
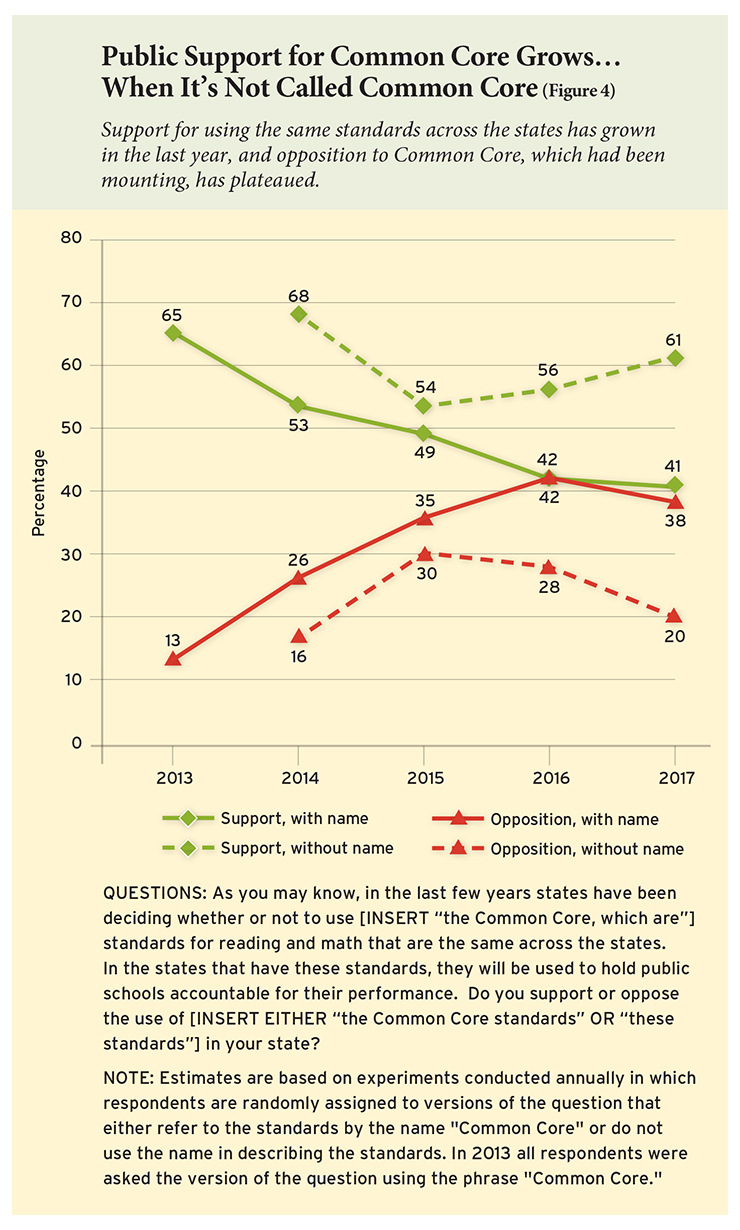
2. Common Core. Support for using the same academic standards across the states has risen since 2016—as long as the “brand name” of Common Core is not mentioned. When the Common Core name is stated, the level of support remains essentially the same as it was one year ago, but when the question simply asks about standards “that are the same across the states,” public support rises by 5 percentage points over what was observed last year.
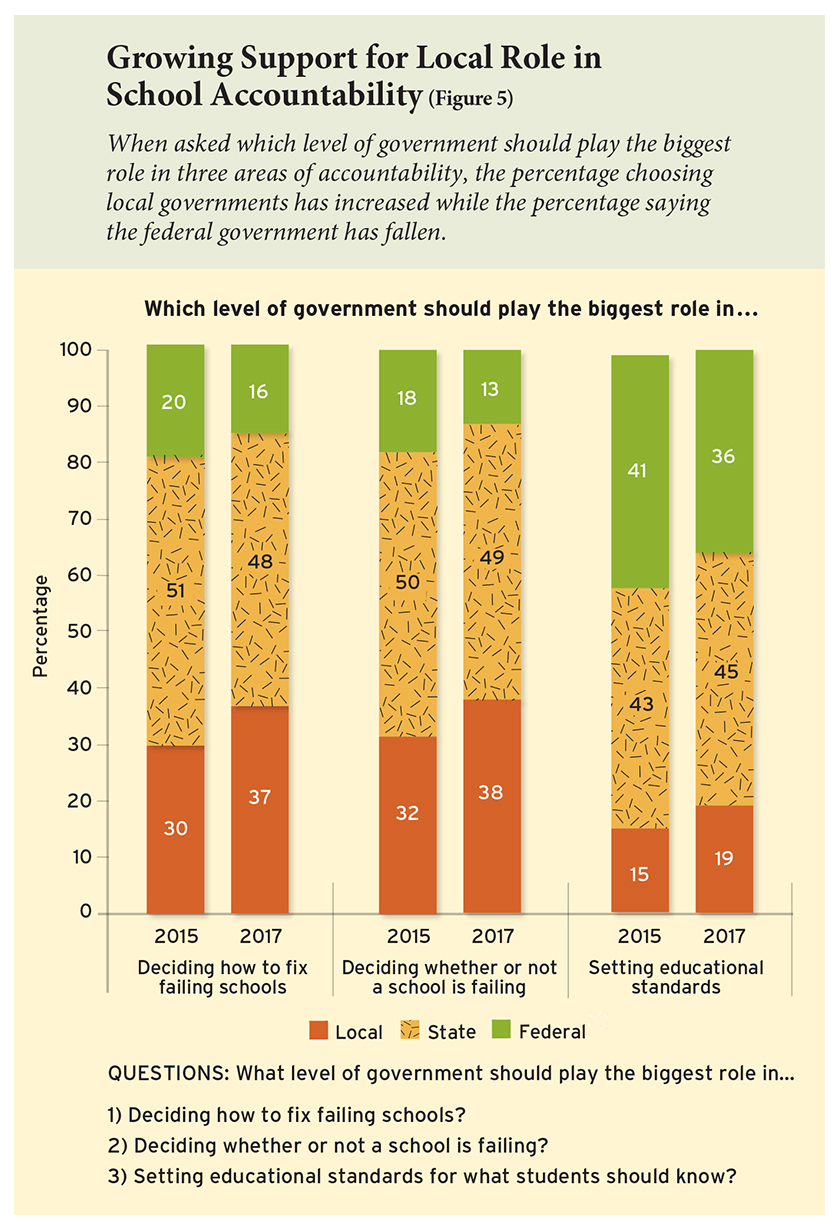
3. Federalism. Compared with 2015, the public prefers a smaller role in education for the federal government and a larger role for local governments in three policy areas: setting standards, identifying failing schools, and fixing failing school. However, a clear plurality continue to prefer that state governments play the predominant role in these areas.
4. Teacher policies. The public is showing an increased resistance to change when it comes to policies affecting teachers. The percentages favoring merit pay, an end to teacher tenure, and increases in teacher salaries are all down about 5 percentage points. In each case, however, a plurality continue to support reform.
5. Trump effect. Half of the respondents were told of Trump’s position on four issues—Common Core, charter schools, tax credits, and merit pay. The other half were asked the same question without mention of the president. In general, the effect of being told the president’s position was to boost support among Republicans and reduce it among Democrats. The overall impact, however, was roughly nil.
6. Immigration and English-only instruction. Two thirds of the public prefer that students whose native tongue is not English be immersed in English-only classrooms. That percentage remains the same when the students are identified specifically as immigrants. Among whites, 75% of those without a university degree prefer English-only classrooms, compared to 60% of those holding a degree. The public is equally divided as to whether school districts should receive extra federal assistance if they have a sizable percentage of immigrant students.
7. Technology. Forty-four percent of the respondents think the effects would be positive if students spent more time on computers at school, while 35% think the effect would be negative.
8. Religious afterschool student clubs. The general public is more favorable toward allowing Muslim students to form afterschool clubs than it was in 2008. At that time, 27% supported such clubs, 23% opposed them, and 50% took a neutral position. In 2017, those percentages are 45% support, 27% oppose, and 28% neutral.
9. Parents’ aspirations for their children’s higher education. Two thirds of the public would have their child pursue a four-year university degree, while only 22% would choose a two-year associate’s degree at a community college, and 11% would choose neither. These percentages do not change significantly when respondents receive information about both the costs and the earnings associated with each degree. However, the cost-and-earnings information shifts the share of Hispanic respondents preferring the four-year degree upward to levels comparable to those among whites. Meanwhile, 75% of Democrats not provided information would prefer their child to pursue a four-year degree, as compared to 57% of Republicans. This partisan difference disappears when respondents receive information about the costs and benefits of the bachelor’s and associate’s degrees. When informed, the percentage preferring the four-year degree is 66% for Democrats and Republicans alike.
10. Varying views by level of education. Among white respondents, 64% of those with a university degree say their local schools deserve a “grade” of A or B, while only 51% of those without that degree rate their local schools that highly. Respondents’ views also varied with their level of education on other issues, including school spending, teacher salaries, merit pay, and school vouchers.
|
Podcasting the Poll Listen as Editor-in-chief Marty West and Senior Editor Paul E. Peterson discuss several topics from this year’s EdNext Poll in a series of podcasts: • EdNext Podcast: Poll Finds Decline in Support for Charter Schools • EdNext Podcast: Which Parents Want a Four-Year College for their Children? • The Education Exchange: Should Muslim Students Be Allowed to Form Afterschool Religious Clubs? |
 Charter schools. “President-elect Trump is going to be the best thing that ever happened for school choice and the charter school movement,” crowed former New York City mayor Rudy Giuliani in November 2016 in his capacity as vice chairman of the president-elect’s transition team. As a candidate, Trump embraced school choice, and he soon followed through by tapping longtime choice advocate Betsy DeVos as his education secretary. The president’s first budget proposal, released in May, includes an increase of nearly $200 million for the federal Charter Schools Program and a package of other choice-friendly programs.
Yet some in the charter school community have worried that vocal support from a polarizing president could prove to be a mixed blessing, at best, for a reform that has long enjoyed bipartisan support. “The rhetoric we hear from the Trump people, ‘Choice is good, and school districts are bad,’ sets us back a decade,” Robin Lake, director of the Center on Reinventing Public Education, told journalist Richard Whitmire. “The last thing we need is for the president to play into that narrative.” Shavar Jeffries, president of Democrats for Education Reform, was more pointed: “I can’t think of anything more potentially harmful to the charter school movement, or anything more antithetical to its progressive roots, than having Donald Trump as its national champion.”
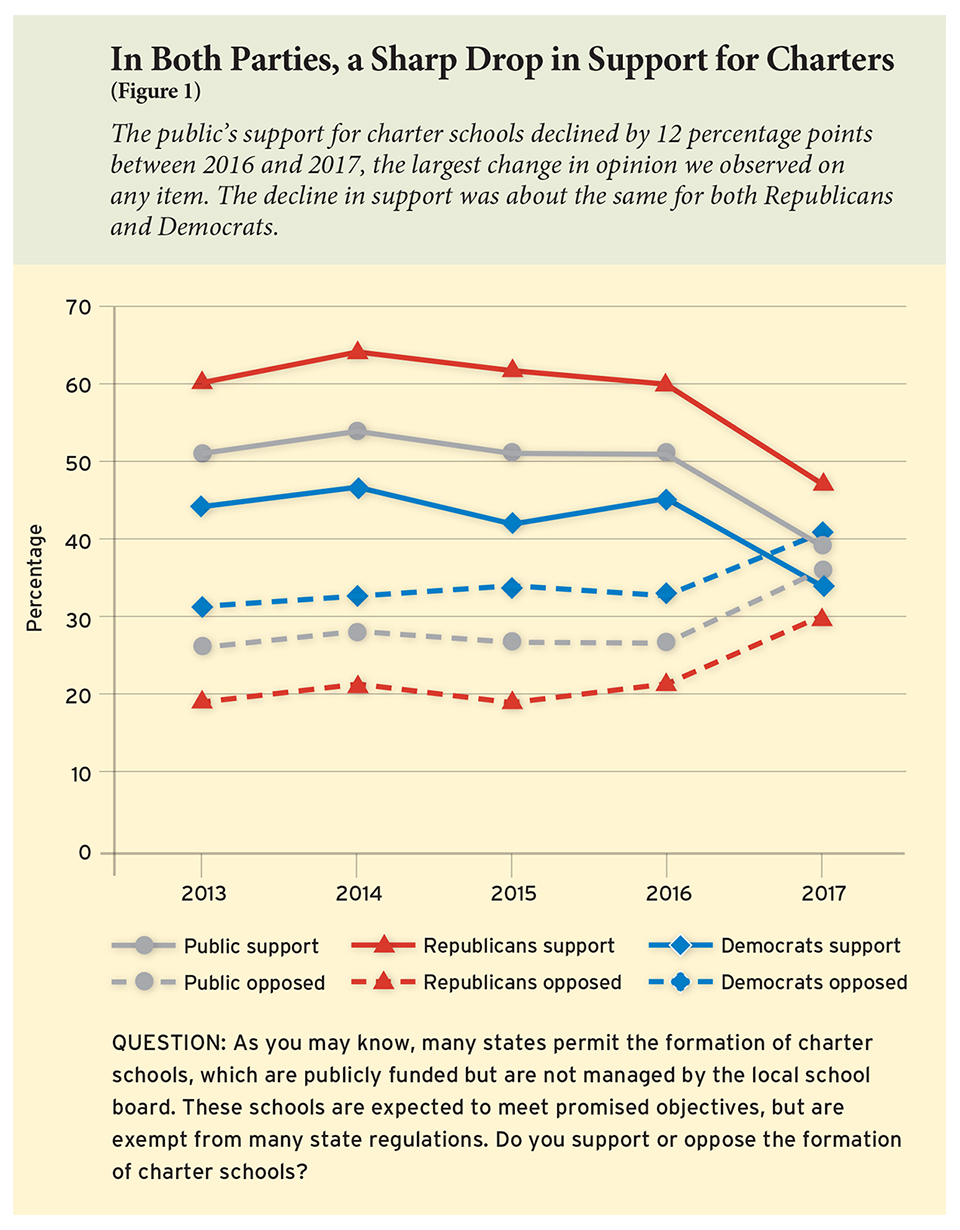
At first glance, our survey data would seem to confirm those fears: Support for charter schools dropped by 12 percentage points between 2016 and 2017, the largest change in opinion we observed on any item (Figure 1). Upon closer inspection, however, the decline is not clearly linked to the occupant of the Oval Office. Directly informing Americans of the president’s position on charters actually lifts their level of support. Further, support for private-school choice, which Trump also endorses, holds steady and may have ticked upward over the past year.
First, the decline: 39% of respondents say they support “the formation of charter schools,” which is down steeply from 51% in 2016, but still a bit higher than the 36% who express opposition this year. (Roughly one in four respondents takes no position on charter schools, perhaps reflecting the fact that many Americans remain unfamiliar with them.) Support has also fallen within the minority community—from 46% to 37% among blacks, and from 44% to 39% among Hispanics.
One might expect that this year’s decline in support for charters would be concentrated among Democrats, given the position taken by Trump, but that turns out not to be so. Support falls by 13 percentage points among Republicans (from 60% to 47%) and by 11 percentage points among Democrats (from 45% to 34%), leaving the partisan gap on the issue largely unchanged. As expected, the effects of informing respondents that “President Donald Trump has expressed support for charter schools” differ across party lines, lifting Republican support by 15 percentage points while reducing it by 3 percentage points among Democrats. But the net effect of hearing the president’s position is to increase overall support by 6 percentage points, to 45%.
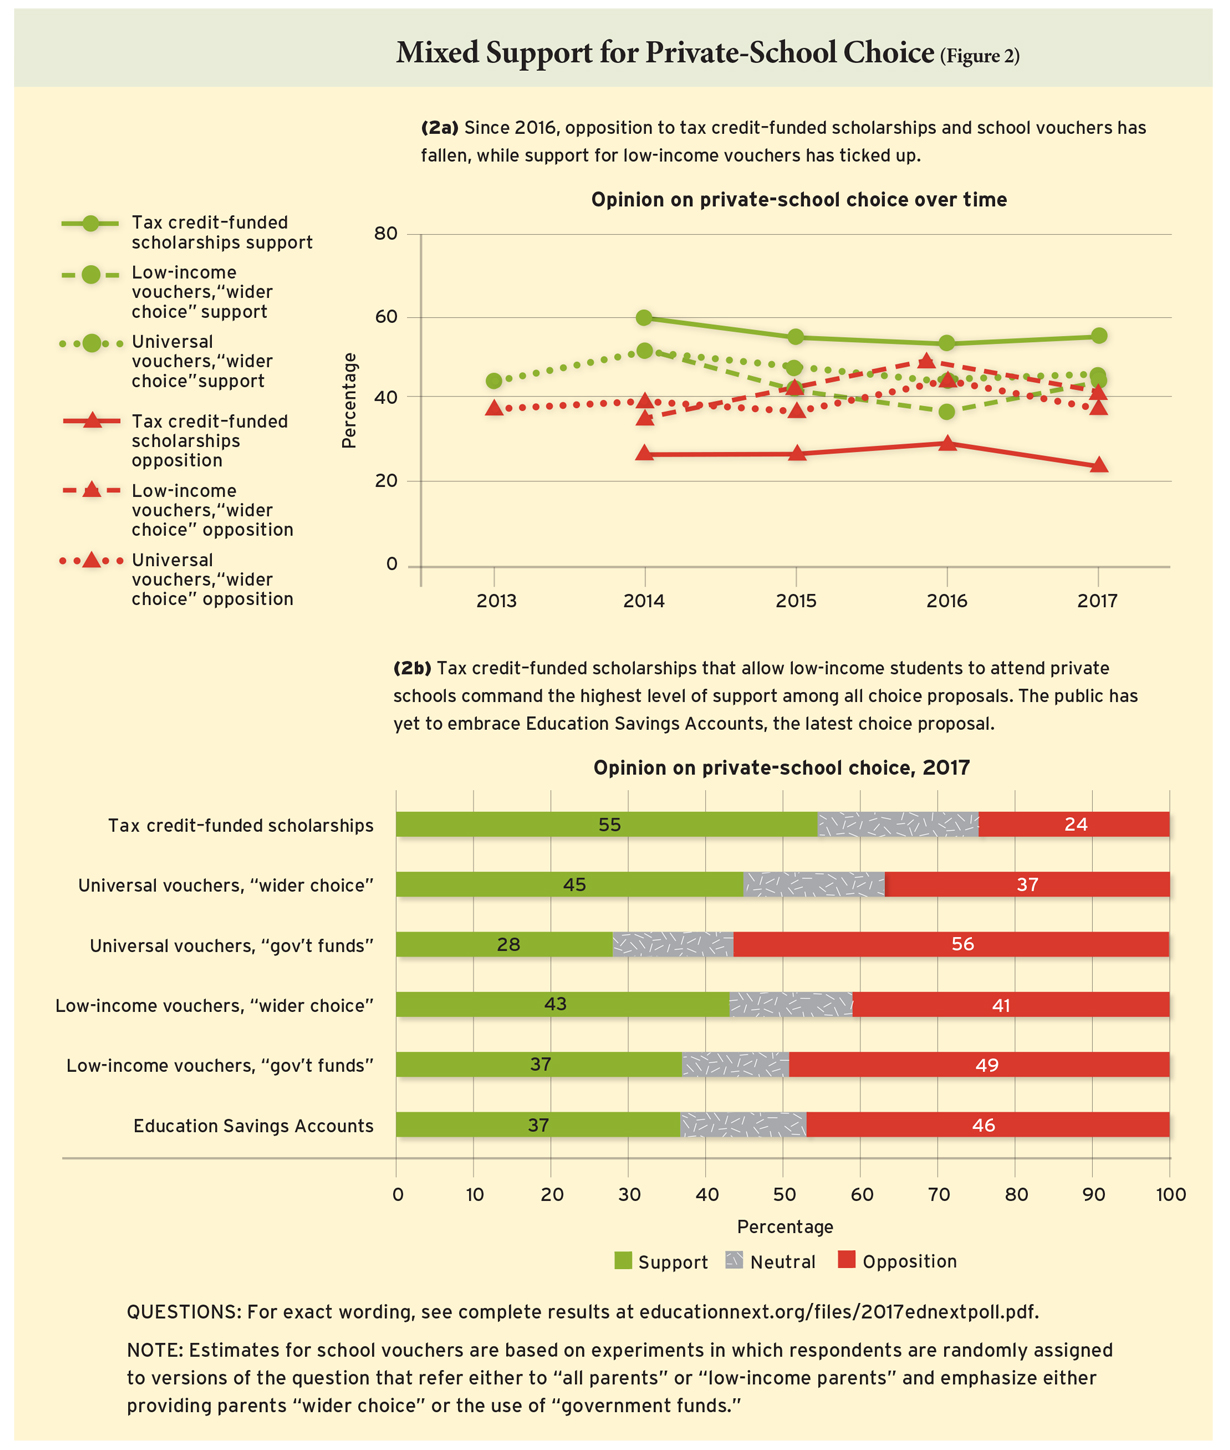
Private-school choice. Figure 2a shows that the public’s opposition to other school-choice policies has lessened. A year ago, 29% of the public opposed tax credit–funded scholarships that allow low-income students to attend private schools—an approach that is now used by 16 states and rumored to be under consideration by the Trump administration. That percentage has fallen to just 24%. Tax credits continue to command the highest level of support among all choice proposals (Figure 2b). Fifty-five percent of respondents favor the idea, a level not noticeably different from last year.
Opposition to vouchers has also declined. When asked whether they favor universal vouchers—giving vouchers to “all families” in order to give parents a “wider choice”—only 37% of the general public express opposition, down from 44% a year ago. Supporters, at 45%, now have a clear plurality. Opposition to vouchers for low-income parents to give them “wider choice” also fell, from 48% to 41%, while the level of support ticked upward from 37% to 43%.
Half our sample was instead asked a question about vouchers that did not mention wider choice for families but referred to the use of “government funds” for private-school tuition. This version of the voucher question consistently draws lower levels of support. When it is used this year to inquire about vouchers for low-income families, however, support rises from 31% in 2016 to 37%, while opposition drops from 55% to 49%. The “government funds” question fetches very low levels of support when respondents are asked about vouchers for all families. Only 28% like the idea, while 56% oppose it, about the same as a year ago.
To sum up, in three of the four phrasings of the voucher question—the two that emphasize choice and the one that emphasizes the use of government funds to support low-income families—we find a decline in public opposition. In no instance do we find a slippage in support, and in the case of vouchers for low-income parents we see an increase of 6 percentage points.
Larger changes are observed within each political party. For example, support for universal vouchers when family choice is emphasized has increased by 13 percentage points among Republicans (to 54%) and fallen by 9 percentage points (to 40%) among Democrats, a shift that brings the views of partisans in the electorate more in line with their elected officials. All in all, however, support from Trump and DeVos may have advanced the tide for private-school choice.
Education savings accounts, the most recent choice proposal, have yet to capture public support. In theory, the concept might appeal to those who think taxpayers who don’t use public schools should get other benefits instead—and to proponents of allowing parents even greater flexibility and choice than vouchers offer them. But the general public has yet to embrace that logic. Only 37% think the government should provide parents who do not use public schools with money to pay for “educational expenses such as private-school tuition, tutoring, and transportation.” Even Republicans split down the middle on this question.
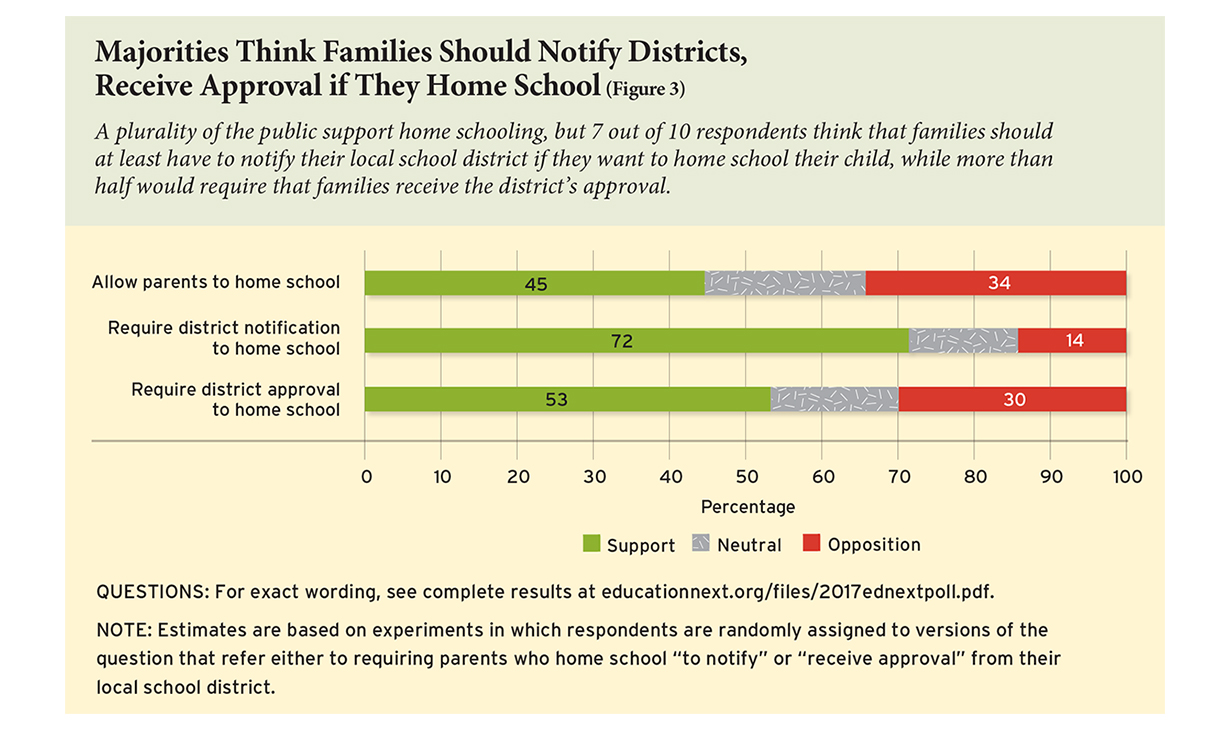
Home schooling. The more long-standing idea of allowing parents to educate their children at home draws somewhat higher levels of support. In 2017, for the first time, we asked Americans whether they supported “allowing parents to educate their child at home rather than sending them to school,” an option parents have chosen for an estimated 2.3 million students nationwide. Forty-five percent of respondents support the home-schooling option, with just 34% opposed. At the same time, 72% of respondents say that families should at least have to notify their local school district if they want to home-school their child, while 53% would require that they receive the district’s approval (Figure 3).
In sum, the sharp drop in support for charter schools constitutes the major change in the school-choice battle over the course of the past year. The change could reflect the waning influence of the Obama administration, which had for years sustained bipartisan support for charters through its Race to the Top and No Child Left Behind waiver programs. Despite a record of supporting charter schools, presidential candidate Hillary Clinton questioned their effectiveness in her campaign by saying that they “don’t take the hardest-to-teach kids or, if they do, they don’t keep them.” The progressive wing of the Democratic Party, led by Senators Bernie Sanders (officially an independent) and Elizabeth Warren, opposes charters even more vehemently, and the civil rights movement has also backed away from charters. The NAACP, for example, has called for a moratorium on charter school expansion until, among other things, charters “are subject to the same transparency and accountability standards as public schools.” In this new climate, teachers unions openly organized against charter expansion in Massachusetts, Washington State, New York City, Chicago, Los Angeles, and elsewhere. The impact of these developments on public opinion seems to have gone well beyond the confines of the Democratic Party.
Common Core, Testing, and Accountability
 The Common Core State Standards have been subjected to relentless criticism over the past year. Trump called them a “total disaster,” a view shared by most candidates for the Republican nomination, while Clinton, though favorably inclined toward Common Core, made little effort to promote the concept. Upon her nomination as education secretary, Betsy DeVos promptly sought to comfort Common Core critics by tweeting, “I am not a supporter—period.” Though the standards remain on the books in most states, roughly half of participating states have withdrawn from efforts to develop common tests aligned to the Common Core. If any education policy seemed destined for the trash can after Trump’s election, this was it. But as it turns out, the story is more complicated.
The Common Core’s popularity had been sliding prior to Trump’s rise. From 2013 through 2016, public support for the Common Core steadily eroded, from 65% to 42%. Meanwhile, opposition more than tripled, from 13% to 42%. Yet this year that downward trend has suddenly come to a halt (Figure 4). At 41%, the level of support shows no real change from a year ago. The percentage opposed, at 38%, also tracks closely to 2016. The escalating trend of opinion against Common Core may have run its course.
Republicans remain more opposed to the Common Core than Democrats. Roughly half of Republicans (51%) oppose the Common Core and only about a third (32%) support it. The pattern is reversed among Democrats, who support Common Core by a 49%–28% margin. Teachers, meanwhile, are evenly split on the standards, with 45% in favor and 44% opposed, as compared to 41% support and 51% opposed in 2016. Proponents can hope that this upward shift in teacher support could prefigure gains more generally in the future.
Opposition to the Common Core partly reflects a tainted brand name rather than antagonism to the concept of shared state standards. Support for using “standards for reading and math that are the same across states” is much higher when no mention is made of Common Core. We identify this effect by randomly assigning respondents either to a version of the question that explicitly refers to “Common Core” or to a version that leaves the name out. A substantial majority of the public (61%) support the general concept of standards that are the same across the states—20 percentage points higher than the share that supports “Common Core.” The effect is even larger among Republicans, boosting support by 32 percentage points, to 64%. Among Democrats, support increases by 12 percentage points, to 61%, when the phrase “Common Core” is dropped.
The hike in support for standards when Common Core is not mentioned is larger this year than last, especially among Republicans. Last year, dropping the name increased support 14 percentage points among the total sample and 17 percentage points among Republicans.
Overall, support for generic shared standards rose from 56% in 2016 to 61% in 2017. Now, members of the two major parties are indistinguishable in their support for shared state standards, so long as they are not called Common Core. This may explain why many states are leaving the standards in place, in some cases with modest tweaks, but forgoing any mention of Common Core.
Testing and accountability. Even as the Common Core continues to divide Americans, support for testing and school accountability enjoys broad support not only across party lines, but also among parents and, in some instances, among teachers.
Nearly two thirds of the public favor the federal government’s requirement that all students be tested in math and reading each year in 3rd through 8th grade and at least once in high school, and only 24% oppose the policy. Republican support (62%) and Democratic support (66%) are both strong. Parents of school-age children are just as supportive (63%) as the public at large. Teachers are an exception, however: a slight majority, 52%, oppose the annual testing requirement.
Teacher opinion more closely resembles that of the broader public on the issue of allowing parents to opt out of state testing of students. Fifty-eight percent of teachers oppose allowing parents to opt out, which is close to the shares among the public (63%) and parents (55%).
The exception to the public’s broad support for testing is a requirement that students in publicly funded preschool programs take state tests of early reading and math skills. Only about half of the public (49%) favor state testing in preschool and one third (34%) oppose it. Teachers are even more opposed to testing in preschool: only 34% support and 56% oppose.
The public also strongly favors laws allowing states to take control of local districts where academic performance has been low for several years. Sixty-nine percent of Americans support these laws, including 75% of Republicans, 67% of Democrats, and 71% of parents. Teachers are less favorable toward these laws but nevertheless lean toward support, with 50% in favor and 42% opposed.
There is even more support—and consensus—on allowing states to take control of local school districts where there is evidence of financial mismanagement. Among the general public, 77% favor laws granting states this authority, with Republicans, Democrats, and teachers equally supportive.
Even though the public would have the state take control of local districts when fraud is identified, public opinion is shifting away from federal direction to local control of the schools. In December 2015, well before Trump’s election, Congress passed the Every Student Succeeds Act (ESSA), which shifted most control of K–12 education policy to state and local governments. DeVos echoed that doctrine at her confirmation hearing: “It won’t be Washington, D.C., that unlocks our nation’s potential. . . . The answer is local control.” The public, despite its support for common state standards, seems to agree.
To gauge public views on this subject, we asked half of our respondents to indicate which level of government should play the biggest role in three areas: 1) setting educational standards for what students should know; 2) deciding whether or not a school is failing; and 3) deciding how to fix failing schools. A plurality of the public think state governments should play the biggest role in each of these areas (45%, 49%, and 48%, respectively). Those percentages have not changed significantly since 2015, the last time we posed these questions. We asked the other half of our respondents to give their best guess as to which level of government actually does play the biggest role in these areas. A majority of the public also thinks that state governments do in fact play the biggest role in each of these policy areas.
However, Figure 5 shows that opinion on the roles of both the federal and local governments has shifted noticeably on all three items. Only 36% of the public think the federal government should play the largest role in setting standards, down 5 percentage points from 2015; only 13% think it should identify failing schools, also down 5 percentage points; and only 16% think the federal government should be responsible for fixing schools, down 4 percentage points. The share of the public thinking these policies should be a local responsibility is up by 4, 6, and 7 percentage points for the three areas, respectively. Changes were similar among Republicans and Democrats alike. In short, opinion has shifted modestly away from federal control toward local control over the past two years. However, a clear plurality still think accountability policy is and should be a state responsibility.
Teacher Performance and Policies
Evaluating teachers. Jason Grissom of Vanderbilt University and Susanna Loeb of Stanford University recently asked some 100 principals in Dade County, Florida, to complete a confidential survey about the teachers in their school. On average, the principals rated 15% of teachers as “ineffective.” But the same principals, when asked to evaluate the teachers formally as part of the state’s mandatory evaluation system, gave fewer than 3% of their teachers a less than “effective” score on any of the seven standards against which they were judged.
Dade County is hardly unique. Nationwide, school administrators identify only a tiny fraction of their teachers as ineffective, despite major evaluation-reform efforts by state and federal governments.
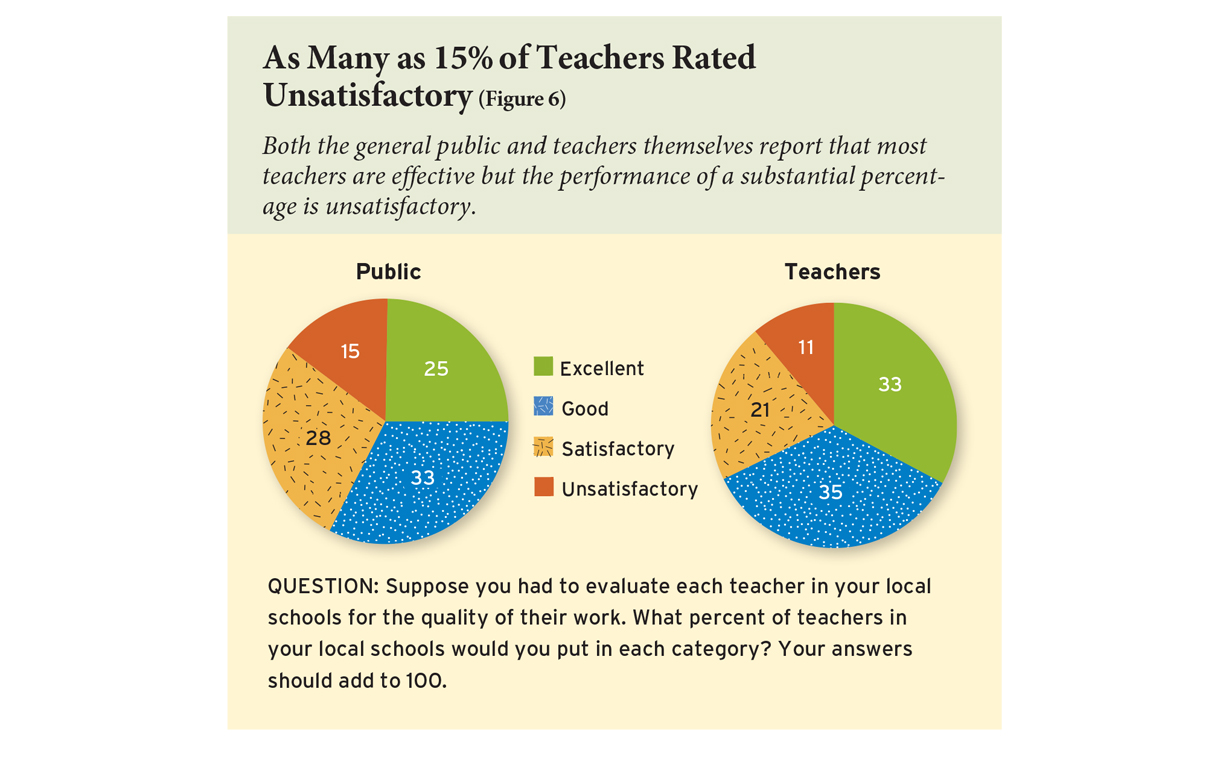
Meanwhile, both the general public and teachers themselves report that, although most teachers are effective, the performance of a substantial share of them is not at an acceptable level. That’s what we learned by asking respondents to indicate the percentage of teachers in their local schools they would assign to each of four categories: excellent, good, satisfactory, and unsatisfactory. On average, the shares of teachers rated as excellent or good are 25% and 33%, respectively, with another 28% identified as satisfactory (Figure 6). But respondents rate as many as 15% of teachers as unsatisfactory, exactly mirroring the views of the principals in Grissom and Loeb’s study. Teachers express somewhat more positive views of their colleagues’ performance than does the public as a whole, but even teachers report that 11% of their fellow teachers perform at an unsatisfactory level.
Teacher salaries. When asked whether teacher salaries should be raised, no fewer than 61% of Americans are in favor. But when told what teachers currently earn, the level of support drops to 36%. Both those readings show a modest cooling of public enthusiasm for higher salaries since 2016—a drop of 4 percentage points for the uninformed and 5 percentage points for the informed. Democrats express strong support for increasing teacher salaries, at 70% among the uninformed and 45% among the informed, as compared to 50% and 27%, respectively, among Republicans. The drop in support among the uninformed is higher among Democrats than among Republicans—8 percentage points as compared to just 2.
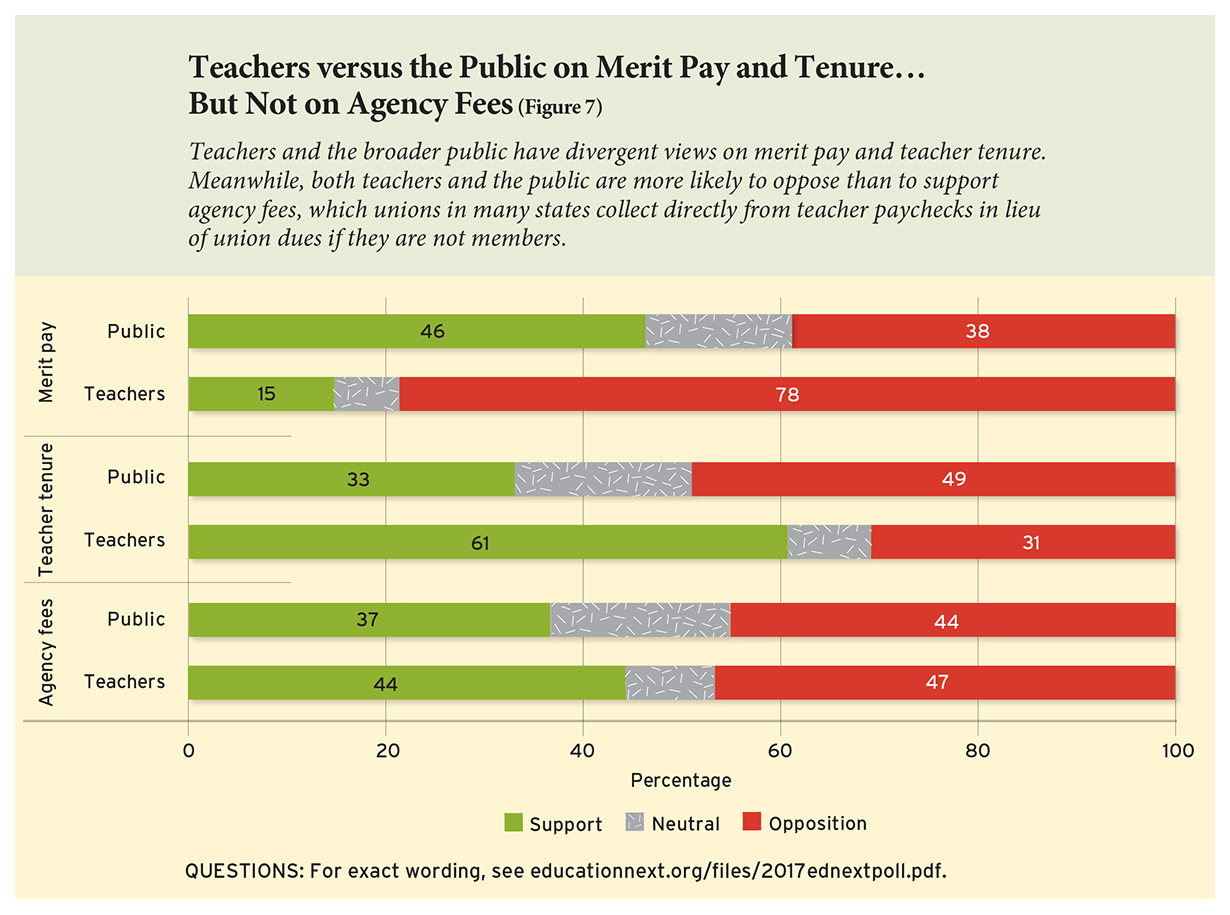
Merit pay and tenure. The cooling in support for salary increases has been accompanied by a similar decline in support for two common proposals aimed at reforming personnel policies (Figure 7). Asked their opinion on “basing part of the salaries of teachers on how much their students learn,” 46% of the public express support, higher than the 38% who are opposed, but down 9 percentage points since 2016. Meanwhile, teachers remain largely united in their opposition to the concept: fully 78% of teachers express opposition to merit pay, against just 15% in support. The gap of 31 percentage points in support between teachers and the broader public is the widest that we observe on any issue in this year’s survey.
Asked about their support for “giving tenure to teachers,” just 33% express a positive view and 49% are opposed—but this reflects a jump in support for tenure of 5 percentage points over the past year. The public’s opposition to tenure contrasts with 61% support among teachers themselves; just 31% of teachers oppose the concept. There is also a noteworthy partisan gap in opinion on tenure: while Republicans oppose tenure by a 62%–24% margin, Democrats are split at 41% to 41%.
Teachers unions and agency fees. Members of the public are evenly divided in their thinking about the influence of teachers unions: 37% say they have “a generally positive effect on schools,” while 37% say they have “a generally negative effect.” Meanwhile, teachers overwhelmingly have favorable views of the unions that represent them, with 64% reporting that unions have a positive effect and just 22% reporting the opposite. Predictably, Democrats and Republicans diverge, with 50% of the former and just 23% of the latter saying that unions have a positive effect on schools.
Quite apart from public attitudes, a key to union success in many states is their ability to collect “agency fees” directly from teachers’ paychecks, whether or not the teachers belong to the union. Unions argue that such fees cover the costs of collective bargaining and therefore benefit all teachers, whether or not they are union members. Opponents of agency fees say they violate teachers’ free-speech rights by exacting money from them even if they don’t support a union presence. Agency fees are collected in 21 states, but the practice could be doomed by a U.S. Supreme Court that may be inclined to prohibit these payments. The court appeared to be on the verge of such a decision in 2016, but Justice Antonin Scalia’s death instead led to a 4–4 deadlock, leaving a pro-union lower-court decision intact. With new challenges to agency fees now making their way through the federal court system, and a new, conservative justice on the high court, the issue could be ripe for a definitive resolution.
What does the public think of agency fees? Forty-four percent of respondents oppose the practice of requiring teachers to pay fees to unions they choose not to join, while just 37% support the practice, much the same as a year ago. More surprising, perhaps, is the fact that teachers themselves are also more likely to oppose agency fees than to support them, by a narrow 47%–44% margin. Despite holding positive views of union influence, then, many teachers apparently think that they should be able to decide whether or not to contribute money to support union activities at the bargaining table.
Some educational issues tend to spark large partisan rifts (for example, Common Core and teacher tenure), while a bipartisan consensus emerges on others (for instance, required testing of students). What are the roots of partisan polarization? To what extent is it fostered by presidential campaigns and a change in partisan control of the presidency?
To gauge how political context might shape partisan polarization, we look at the results from a series of experiments in which we randomly divide our polling sample into two equal groups. Half of the respondents were simply asked for their opinion on an issue, while the other half was first told Trump’s position on it. We conducted these experiments on four topics: Common Core, charter schools, tax credits, and merit pay for teachers. Trump opposes the Common Core but supports the other three policies.
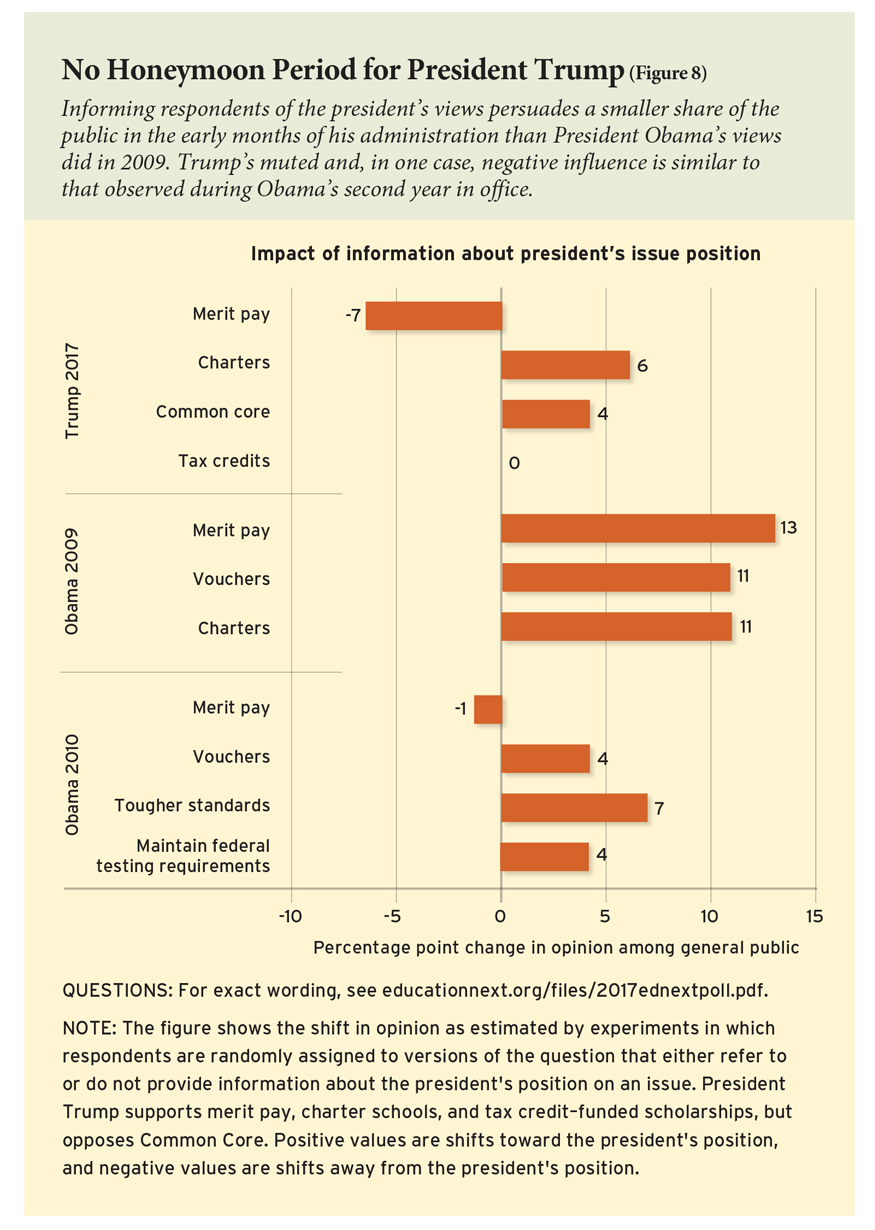 In general, Trump’s endorsement of a policy has tended to polarize public opinion. Republicans who are informed of his position move toward it on three of the four issues: we observe a 5-percentage-point increase in opposition to Common Core, a 15-percentage-point increase in support for charter schools, and a 10-percentage-point increase in support for tax credits. Meanwhile, Democrats who are told the president’s position move away from it on two of the four issues: we see a 7-percentage-point decrease in support for tax credits and a 14-percentage-point decrease in support for merit pay. In no case does information about the president’s position shift the percentage of Democrats in his direction by a significant amount. Figure 8 shows that the net effect of Trump’s taking a position on the issue is roughly nil. The gains the president makes among Republicans are offset by the losses he suffers among Democrats.
By comparison, President Barack Obama, during his first year in office, was able to shift overall public opinion in the direction he preferred on multiple education issues, as we saw from similar experiments we performed as part of our 2009 survey. That year, we found large shifts toward Obama’s positions on charter schools (an 11-percentage-point increase in support), vouchers (an 11-percentage-point decline in support), and merit pay (a 13-percentage-point increase in support). Furthermore, knowledge of the president’s position moved both Democrats and Republicans toward him on all three issues.
One year later, however, Obama had become a more polarizing figure. The effect of information about Obama’s position in 2010 was both weaker and more divisive than it was in 2009. Republicans no longer moved toward Obama’s position and, in fact, moved further away from it on one of four issues included in 2010 (a 12-point decrease in support for merit pay) even as Democrats continued to move toward the president’s position when told where he stood on the issue, albeit to a lesser degree than they had a year earlier.
Taken together, these experiments suggest that presidents can quickly become partisan figures who help to structure public opinion along party lines. Although a president, during his honeymoon period, may shift overall public opinion in his preferred direction, that accomplishment may be difficult to sustain over time. Further, Trump has had a polarizing effect from the very beginning of his term in office.
Immigration and English-Only Instruction
The rancorous national debate over immigration policy has touched most aspects of civic life, including education policy. To see where the public stands, we asked questions about visa programs for highly specialized workers, federal aid to school districts impacted by immigration, and the desirability of instructing immigrants and students with limited English proficiency in their native language.
Visas for specialized workers. Currently, the U.S. government provides up to 85,000 visas each year to highly educated immigrants identified by American businesses for employment in the United States. Some say that these visas are necessary for filling vital jobs. Others say they take jobs away from American college graduates.
After providing respondents exactly this information, we asked them whether the number of such visas should be increased, decreased, or kept about the same. Only 15% of the public would increase that number. The remainder are evenly divided between the 42% who would cut the number of visas and the 43% who would keep it at its current level.
Federal aid to impacted schools. States with large numbers of immigrants have repeatedly petitioned the federal government for help with the cost of educating their children. Former Arizona state superintendent of education John Huppenthal, for example, has insisted that “it is unreasonable to ask Arizona schools and Arizona taxpayers to pay for these expenses.” On this question, the public divides almost exactly in twain: 39% of respondents support, but 43% oppose “the federal government providing additional money to school districts with large numbers of immigrant children.” Again, a substantial partisan divide surfaces: 55% of Democrats like the idea, as compared to just 20% of Republicans.
English-only instruction. According to Jim Cummins, professor emeritus at the University of Toronto, children’s levels of performance in a second language depend on their ability to speak their native tongue. Many educators agree, but according to Rosalie Pedalino Porter, writing in the Atlantic, “the accumulated research of the past thirty years reveals almost no justification for teaching children in their native languages to help them learn either English or other subjects.”
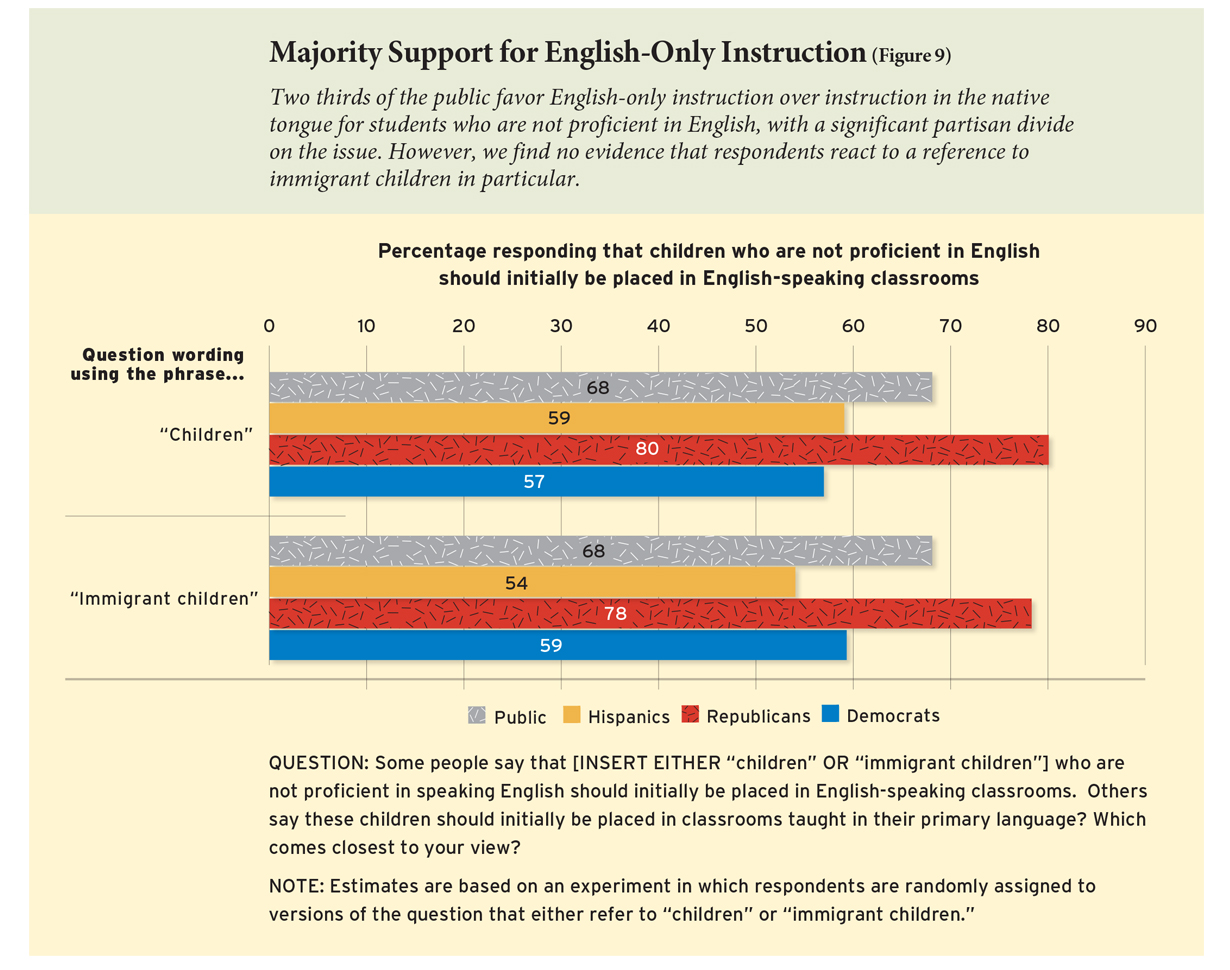
To gauge public views on this issue, we asked people whether immigrant children “who are not proficient in speaking English should initially be placed in English- speaking classrooms” or “initially be placed in classrooms taught in their primary language.” Two thirds of our respondents oppose initial instruction in the native tongue for immigrants (Figure 9).
A clear majority of Hispanics (59%) also favor initial instruction in the English language. However, we do not find evidence that people react against native instruction for immigrants in particular. When the question does not specifically refer to immigrants, the proportions for and against remain largely unchanged for the public as a whole. Among Hispanics, 54% favor initial instruction in the English language, slightly fewer than the percentage favoring that policy when immigrants are not mentioned.
The use of technology in schools continues to advance, and significant opposition to it has receded. In the 2016 EdNext survey, however, we found some evidence of a drop-off in support for blended learning. This year, therefore, we delved more deeply into people’s attitudes toward digital instruction in schools.
We first asked respondents about increasing the use of digital technology for instructional purposes. Forty-four percent of respondents believe that having students spend more time using computers or other digital devices would have a generally positive effect on student learning, while 35% believe the effect would be negative.
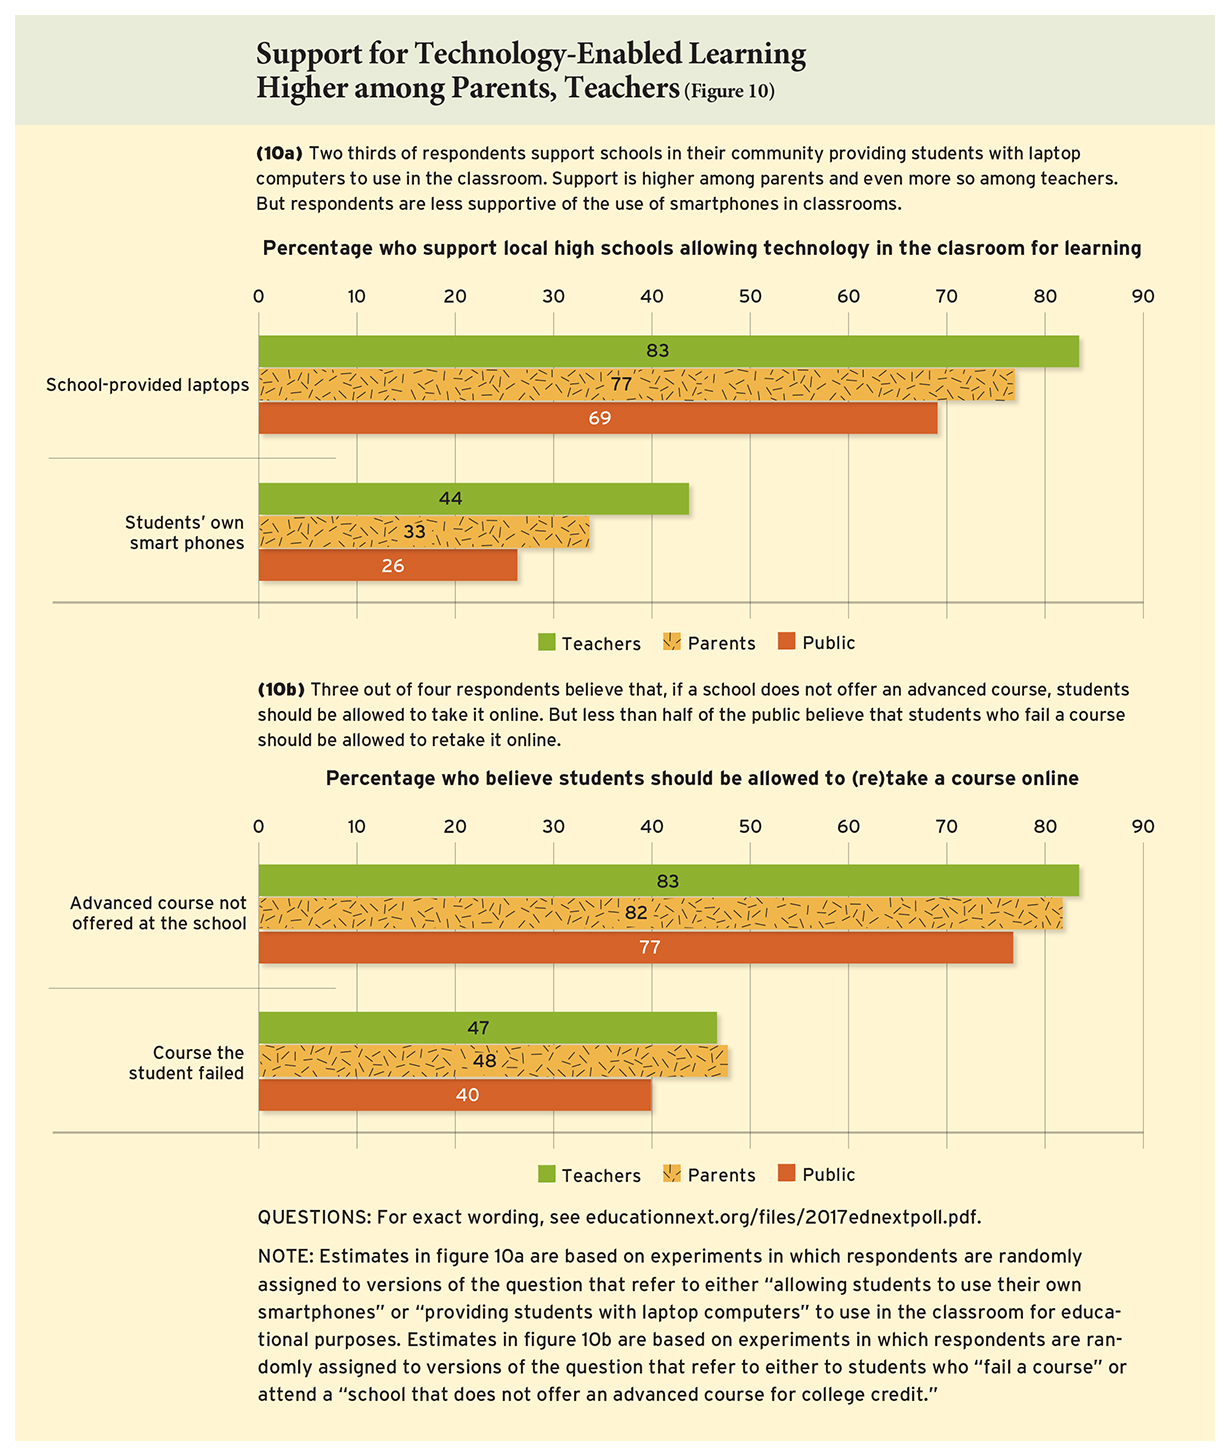
An even greater proportion of respondents (69%) support the idea of schools in their community providing students with laptop computers for classroom use (Figure 10a). Approval is higher among parents (77%) and even more so among teachers (83%). Respondents show less support for the use of smartphones in classrooms. Just 26% favor allowing students to use their own smartphones in the classroom for educational purposes. Again, parents (33%) and teachers (44%) express more support than the public at large.
We also gauged opinion on students taking courses online (Figure 10b). Respondents believe, on average, that high-school students should be allowed to take just over one third of their courses for credit online. Forty percent of respondents believe that students who fail a course should be allowed to retake it online, and 77% say that if a school does not offer an advanced course, then students should be allowed to take it online. Support for allowing students who fail a course to retake it online is approximately 8 percentage points higher among both parents and teachers than among the public as a whole, and support for taking advanced courses online is 5 and 6 percentage points higher, respectively.
These responses raise the question of why parents and teachers more frequently express support for technology in schools than does the public at large. Could it be that the firsthand experience of parents and teachers gives them a better understanding of the positive benefits of new technologies? And perhaps some teachers have seen that, with today’s generation of educational technology (such as that supporting many blended-learning environments), the teacher is still captain of the classroom. In any case, there is little sign that teachers believe technology poses a threat to their role as the decisive figure within the American classroom.
Tolerance of Afterschool Clubs Formed by Religious Students
As partisan controversies and multiple lawsuits proliferate over the Trump executive order banning migration from six Muslim-majority countries, many have expressed concern as to whether the American tradition of tolerance of other religious groups would be extended to practitioners of Islam, one of the world’s largest religions.
Even before the 2016 election, a Pew Research Center report said Muslims (along with atheists) got the coldest reading on a thermometer measuring feelings toward other religious groups. Since the election, NBC News has reported a tripling of “hate crimes targeting Muslims, their mosques and businesses.”
“A lot of Muslim students are scared,” a University of Tennessee student told the New York Times. A Muslim doctor in a small Minnesota town now wonders “whether the people who had [once] seemed so warm were secretly harboring hateful thoughts or suspicions about” his family, the Washington Post reported.
Most of these reports are anecdotal, or they report actions taken by scattered individuals. They do not measure change in the general state of public opinion. Have public views toward Muslims declined? We sought to cast some light on this heated topic with the following survey question, posed in 2008 and again in 2017: “Do you support or oppose allowing a group of Muslim students to organize an afterschool club at your local public school?” To allow for comparisons with other groups, we asked the same question about generically “religious” students, as well as “Evangelical” and “atheist” students. To keep questions from contaminating one another, each of four randomly selected groups was asked about just one religious orientation.
We chose to ask specifically about clubs formed by religious students because the Supreme Court has approved this form of religious activity in schools. In Good News Club v. Milford Central School (2001), the court found that restrictions on such afterschool clubs taking place at school facilities violated students’ rights to free exercise of religion. But journalist Katherine Stewart, in her book The Good News Club: The Christian Right’s Stealth Assault on America’s Children, questions the decision as follows: “I don’t have a problem with children discussing religious beliefs, but I do have a problem with them believing that those beliefs are sanctioned and endorsed by a public school.”
In answering the survey question, respondents could say they supported club formation by religious groups, opposed it, or neither supported nor opposed it. We moved the placement of this neutral response from the middle response category in 2008 to the last one in 2017, thereby reducing the likelihood that this neutral position would be chosen. To see whether the changes over time are genuine (and not just due to the change of the placement of the neutral category), it is important, therefore, to look at the changes in both support and opposition, as either or both can increase if fewer people choose the neutral opposition.
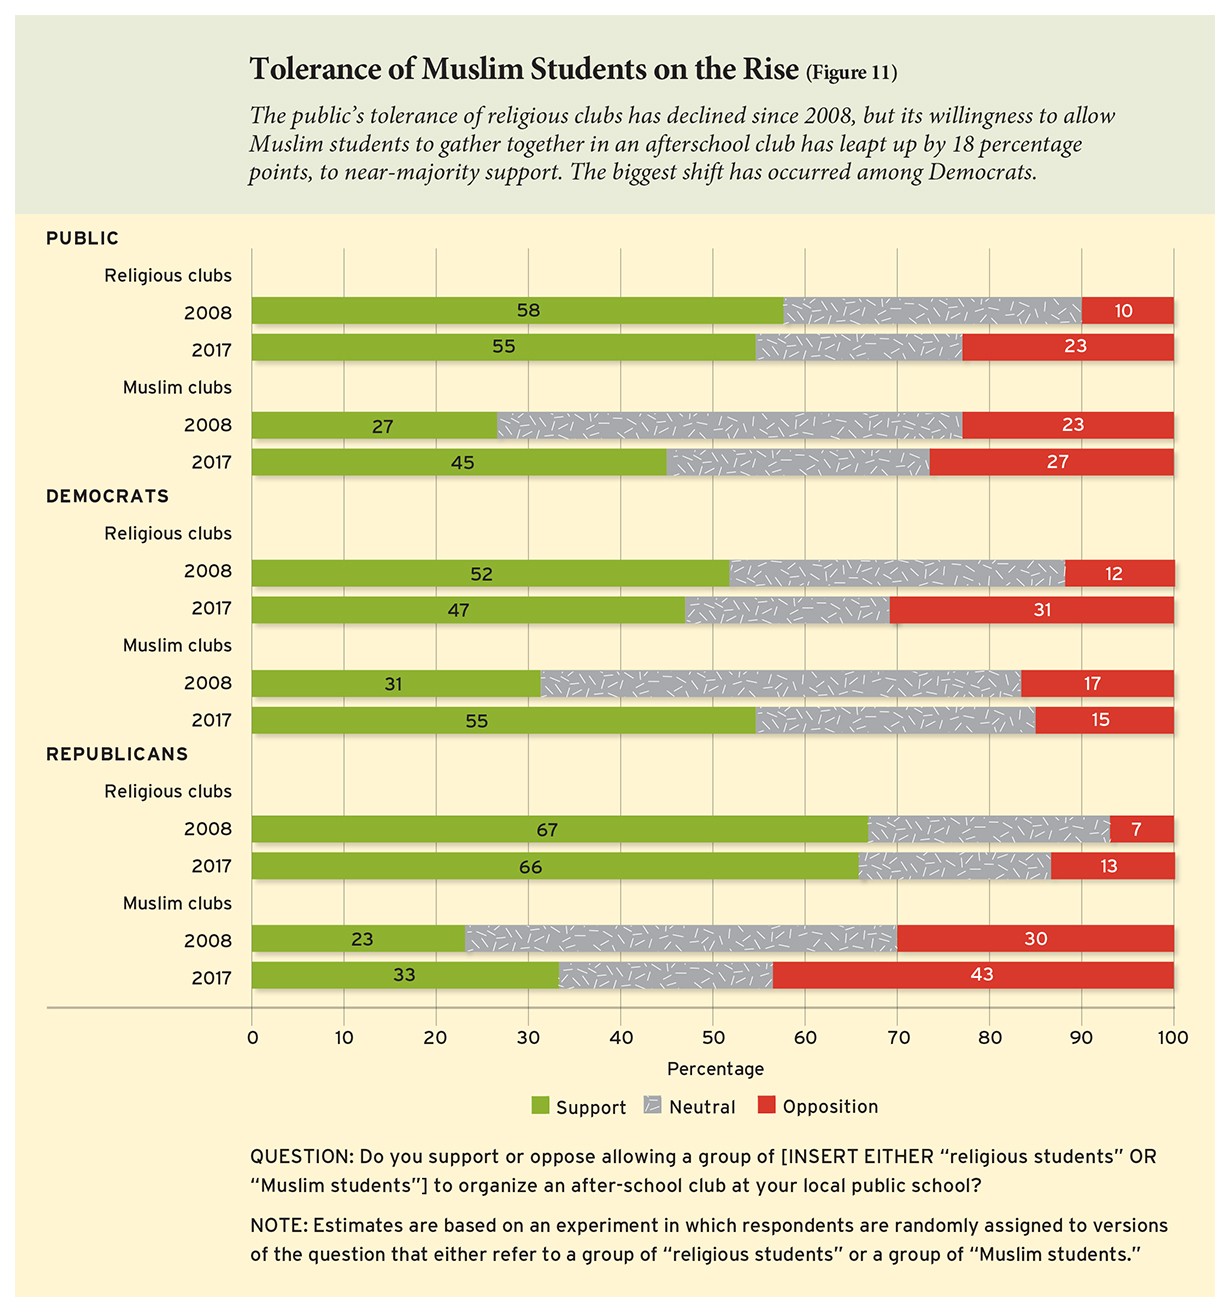
In 2008, members of the public supported the generic right of religious students to form clubs by a decisive margin: 58% favored them, while only 10% opposed them, the rest taking a neutral position. Over the ensuing nine years, however, support for these clubs declines (Figure 11). Approval slips by 3 percentage points, while opposition grows by 13 percentage points.
Despite a declining tolerance for student rights to form religious clubs, the willingness to grant such rights to Muslims climbs dramatically. In 2008, opposition to Muslim club formation, at 23%, was almost as widespread as support, at 27%, with as many as 50% refusing to take a position one way or another. But in 2017, tolerance of Muslim clubs exploded upward by 18 percentage points, to 45%—a near majority of all respondents—while opposition ticked up by only 4 percentage points, to just 27%. What was once a near-even split in opinion now represents about a two-to-one advantage for Muslim club toleration.
The biggest change has occurred among Democrats. Their support for tolerating religious clubs in general has fallen by 4 percentage points, and expressed opposition to the practice has increased by 18 percentage points. Despite this overall decline, Democrats have become dramatically more favorable toward Muslim rights since 2008. Opposition to the formation of Muslim clubs fell by 2 percentage points, while support jumped by no fewer than 24 percentage points. Today, Democrats support Muslim clubs by a 55%–15% margin. (Democrats are also much more likely than Republicans to favor clubs for atheists but less likely to think Evangelical clubs should be allowed.)
As for Republicans, their views on religious clubs in general do not change much, nor do their views on the rights of Evangelicals shift more than a modest amount in a negative direction. They are a bit more open to atheist clubs than they were in 2008. Percentages for and against Muslim clubs have ticked upward in roughly equal amounts. Today, 43% of Republicans would not tolerate them but fully a third say they would.
In other words, the highly partisan debate over Muslim immigration seems to have enhanced toleration of Muslim gatherings—at least in schools—on the part of Democrats, without having an adverse impact on tolerance among Republicans. On net, there has been a steep increase, not a decline, in the public’s inclination to allow Muslim students to gather together after school in a club of their own choice.
Parents’ Aspirations for Their Children’s Higher Education
The economic benefits of attaining a four-year degree have never been higher. According to the College Board, students who complete a bachelor’s degree earn, on average, $15,400 more annually than do students who receive only a two-year associate’s degree ($61,400 versus $46,000). Yet the cost of pursuing a four-year degree is nearly four times that of pursuing a two-year degree. Given these benefits and costs, the relative worth of the two degrees has provoked considerable discussion. Indeed, the advantages of a community college degree have become part of the nation’s political discourse. Speaking at Gateway Technical College in Kenosha, Wisconsin last April, President Donald Trump said, “Vocational education is the way of the future.” A month later, his Secretary of Transportation Elaine Chao elaborated, “The good news is that workers don’t need an expensive four-year degree to access those good-paying jobs.” The Third Way, a middle-of-the-road think tank, warns against excessive focus on 4-year programs: “Many jobs with shortages don’t require a college degree,” it says. Ohio University economist Richard Vedder notes that the “average student loan debt [is rising] above $25,000 and high-paying job opportunities [have] become scarcer.” As a consequence, “the case for attending [a four-year] college diminishes. . . . Many would benefit from a community college education or taking an associate degree at a for-profit institution.” But Princeton economist Cecelia Rouse replies that “claims of skyrocketing student debt have been exaggerated,” and “for most students, the benefits [of a four-year degree] will outweigh the costs.”
What does the American public think? And how much do the economic costs and benefits of attending a four-year rather than a two-year college factor into their views? How much does opinion differ by demographic background? Do Democrats and Republicans disagree on the relative merits of the two degrees?
To answer these questions, we divided our survey respondents into four randomly selected groups. Parents who had at least one child under 18 were asked whether they would prefer their child to attend a university to earn a four-year degree, a community college to earn a two-year degree, or neither. Those who did not have a child in this age range were asked what they would prefer if they had such a child.
The second group was asked the same question after being told the earnings differential between adults with associate’s and bachelor’s degrees. The third group was instead told the average costs of obtaining the two degrees before being asked their preferences. (These costs reflected the average amount students pay in tuition, fees, and room and board after deducting the amount students typically receive in scholarships and grants.) The fourth group was given both cost and earnings information.
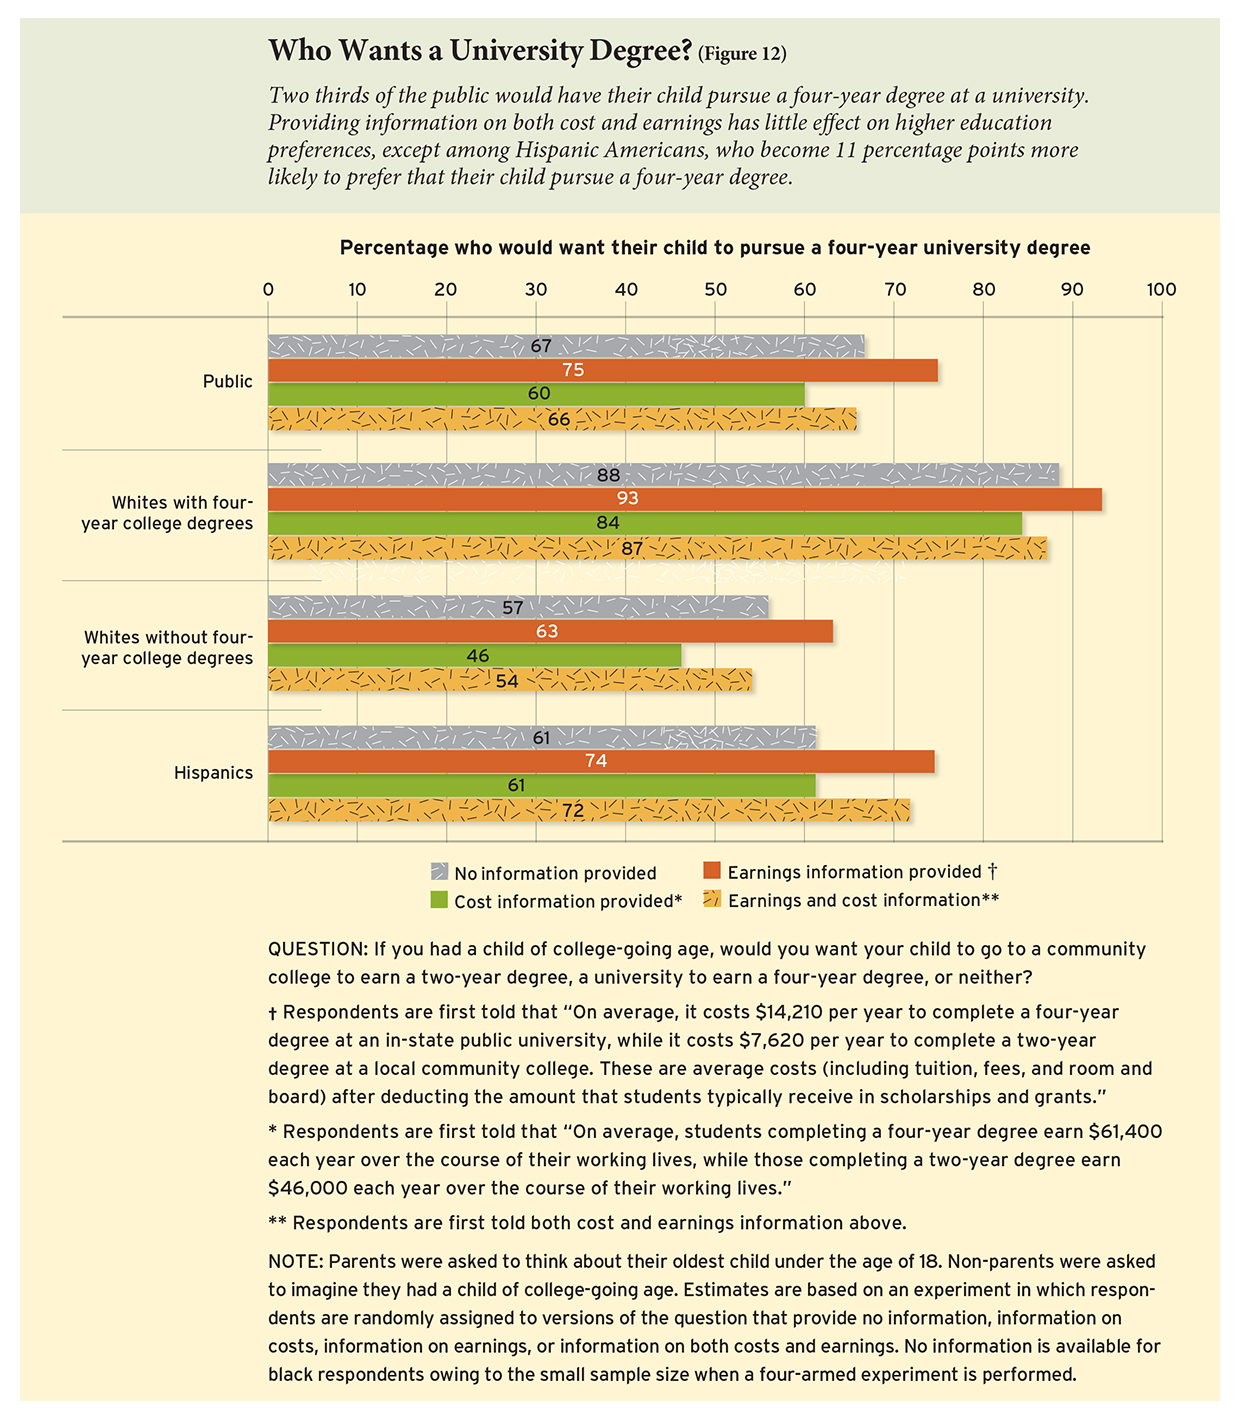
Two thirds of respondents in the first group—those who were asked the question without receiving any information on costs or benefits—said they would have their child pursue a university degree (Figure 12). Twenty-two percent selected the two-year option, and 11% said they did not want either for their child. Parents of children not yet in college were even more likely to choose the four-year option; 80% said they wanted a university degree for their child.
When we compare the group that is told only about costs with the group told only about benefits, the two factors more or less cancel one another out. The percentage of respondents who would have their child pursue a four-year degree drops by 7 points when only cost information is provided, and it increases by 8 percentage points when respondents receive only earnings information. When both pieces of information are supplied, the percentages are essentially the same as when no information is given. The pattern for parents is similar, though only 75% of fully informed parents still want the four-year option, a 5-percentage-point drop from those making that choice without cost-benefit information.
Despite the large majority in favor of a four-year degree for their child, one may expect differences to emerge when one breaks the data out by education and ethnic group. Those with less education—that is, those who themselves do not hold a university degree—are likely to face financial constraints that limit their ability to assist with their child’s education, and they may be less aware of the earnings potential of a four-year degree. Without a full set of information, they may overestimate costs and underestimate benefits. Stanford economist Caroline Hoxby has shown, for example, that talented students from low-income families are more likely to select elite universities if they are given specific information about the costs of attending them.
To see whether such a pattern occurs more generally, we divided the sample of white survey takers into the 1,529 respondents with a four-year degree and the 1,367 respondents without one. Overall, the pattern of responses among these two groups is similar to that of the general public. But only 57% of those without a college degree would have their child pursue one, 31 percentage points less than the 88% who selected that option among those holding a degree. Nor does information close the gap between the two groups. Earnings information, when provided to the less-educated, shifts the percentage upward by 6 percentage points, but cost information drives it downward by 11 percentage points. When both costs and benefits are supplied, just 54% of this group say they would have their child pursue a college degree. The results are nearly identical for those whites who are parents of children 18 years of age or younger.
In other words, less-educated families do not seem to lack the information they need to make college and career choices. Their decisions do not change when they are given the opportunity to compare costs and benefits, suggesting no reason to question the rationality of their preferences. Not only does pursuit of the associate’s degree cost less, by itself a legitimate concern for those with limited means, but the two-year training program, unlike the four-year degree program, also may allow for entry into one of the trades—and it may strengthen ties with families and friends when the new degree holders seek out work opportunities in their home communities. First-generation college-goers may feel they face a significant risk of not finishing a four-year degree program, which also involves venturing into an unfamiliar college culture and lifestyle. Inasmuch as simultaneous information on costs and benefits does not alter the choices made (on average), it is likely that the choice itself is a conscious one that is partly shaped by available financial information.
For Hispanics, informational impacts are quite different. Without information on costs and benefits, the percentage of Hispanics selecting the four-year option trails that of whites by 6 percentage points, but that gap closes when either cost or earnings information is provided. When both types of information are supplied, Hispanic support for college going exceeds that of whites by 7 percentage points. A case can be made that Hispanics would choose a four-year degree with greater frequency had they better information on its costs and benefits. Unfortunately, the sample of African American respondents, once divided into four experimental groups, is too small to provide reliable data on whether or not their preferences change when information is provided.
Democrats and Republicans, meanwhile, have sharply divergent views on the relative merits of the four-year as distinct from the two-year degree. When given no information about costs and benefits, 75% of Democrats, but only 57% of Republicans would prefer their child to pursue a four-year degree. Among parents, the percentages are 82% and 76% for Democrats and Republicans, respectively. However, those partisan differences disappear when respondents are told the costs and benefits of both types of degrees. When informed, just 66% of Democrats would have their child pursue a bachelor’s degree, the same exact percentage as informed Republicans. Nor do we observe a significant partisan gap in the preferences of informed parents. In other words, partisan biases are tossed to one side when the public has accurate information about the costs and benefits of two-year and four-year degrees.
An Education Divide among White Americans
Do whites with less education differ from those with a college degree in other respects as well? The question is of particular interest in the aftermath of the 2016 presidential election. In that election, Democratic candidate Hillary Clinton is reported to have received a higher share of the vote among university-educated voters than among those lacking a degree, a result that runs contrary to the historic ties between the working class and the Democratic Party. A significant gap between the more- and less-educated does not show up on topics such as the Common Core, the assessment of teacher quality at their local schools, teacher tenure, agency fees for non-union teachers, or the impact of teachers unions on their local schools. But on a number of critical topics, the opinion gap between more- and less-educated whites is sizable.
It is striking, for example, that the more-educated respondents give a higher evaluation of the schools in their community than do those who lack a college degree. While it might be thought that those with more education would cast the more critical eye on their local public schools, in fact, 64% of college-educated whites say their local schools deserve an A or a B, as compared to just 51% of the less-educated ones. One possible explanation for the difference is that the less-educated often attend lower-quality schools, so perhaps their perception reflects reality.
The two groups also differ in their understanding of local school finance. The less-educated whites underestimate by almost a third the level of per pupil expenditure in their local community, while the more-educated underestimate it by only a fourth. We observe a similar difference on the issue of teacher salaries. The underestimate of less-educated whites is 29%, as compared to a 20% underestimate for the more-educated ones.
Despite their higher estimates of local expenditures, 55% of the more-educated group favor higher spending, as compared to just 46% of the less-educated. That difference narrows only slightly when respondents are told actual levels of expenditure. The share of the two groups willing to spend more drops by 14 and 12 percentage points, respectively. Almost the same pattern holds for teacher salaries, except the drop in support among the less-educated is very steep, falling from 54% to 28%. Among the more-educated, the decline, though smaller, is still a substantial 16 points—from 63% to 47%.
The less-educated are more likely to want to hold teachers accountable. They favor merit pay based on student learning by a margin of 51% to 30%, while the percentages for the better-educated are quite the reverse—with 42% in favor and 49% opposed. Also, only a fourth of the less-educated like teacher tenure, while that practice captures the backing of a third of the more-educated group. Although the more-educated are more likely to take a position on charters, the balance between support and opposition among those taking a stance is similar for the two groups. When it comes to universal vouchers, the less-educated are 19 percentage points more likely to support them than are the more-educated (52% to 33%). On the other hand, the less-educated are only 5 percentage points more likely to support vouchers targeted to low-income families than are the more-educated (38% to 33%). The more educated are also more likely to oppose tax credit-funded scholarships for students from low-income families.
As might be expected from the results of the last presidential election, the two groups divide noticeably over immigration policy. Only 37% of white respondents with a four-year college degree want a decrease in the number of visas for highly educated workers, as compared to 58% of those without that degree, despite the fact that these visas are most likely to reduce employment options for the more-educated. Also, the more-educated are almost twice as likely as the less-educated to favor channeling more money to schools serving a substantial number of immigrants. Finally, 76% of the less-educated want children of immigrants taught in English-speaking classrooms, as compared to 63% of the college-educated.
Some of these differences predate the 2016 presidential election. Sharp disparities in how the two groups evaluate their local schools date back at least to 2013. So do differences over merit pay for teachers. But the gap over spending on local schools and teacher salaries has opened over the past year. Among those informed about teacher salaries, for example, the gap between the opinions of the more- and less-educated has widened from 10 to 19 percentage points, while among those not informed, the gap grew from 5 to 9 points. On per pupil spending, the size of the gap increased from zero to 9 percentage points among the uninformed and from 4 to 7 points among the informed. Finally, the divide over universal vouchers has increased from 6 to 12 percentage points since 2016.
In sum, we observe strong differences between the more- and less-educated white respondents on assessments of school quality, school spending, teacher salaries, immigration policy, teacher tenure, merit pay, and school vouchers. On the last three items, the differences have grown over the course of the past year. On nearly all of these issues, Trump took positions during the 2016 election campaign that were more closely aligned with the less-educated white respondents in our survey.
Martin R. West, editor-in chief of Education Next, is associate professor at the Harvard Graduate School of Education and deputy director of the Program on Education Policy and Governance at the Harvard Kennedy School. Michael B. Henderson is assistant professor at Louisiana State University’s Manship School of Mass Communication and research director of its Public Policy Research Lab. Paul E. Peterson is professor and director of the Program on Education Policy and Governance at the Harvard Kennedy School, where Samuel Barrows is a postdoctoral fellow.
Download the full results of the 2017 Education Next survey here.
Methodology
This is the 11th annual Education Next survey in a series that began in 2007. Results from all prior surveys are available at www.educationnext.org/edfacts.
The results presented here are based upon a nationally representative, stratified sample of 4,214 adults (age 18 and older), which includes representative oversamples of the following subgroups: parents with school-age children living in their home (2,170), teachers (669), and Hispanics (805). Respondents could elect to complete the survey in English or Spanish; 322 respondents elected to take it in Spanish. Survey weights were employed to account for nonresponse and the oversampling of specific groups.
The survey was conducted from May 5 to June 7, 2017, by the polling firm Knowledge Networks (KN), a GfK company. KN maintains a nationally representative panel of adults (obtained via address-based sampling techniques) who agree to participate in a limited number of online surveys.
We report separately on the opinions of the public, teachers, parents, African Americans, Hispanics, white respondents with household incomes below $75,000, white respondents with household incomes of $75,000 or more, white respondents without a four-year college degree, white respondents with a four-year college degree, and self-identified Democrats and Republicans. We define Democrats and Republicans to include respondents who say that they “lean” toward one party or the other. In the 2017 EdNext survey sample, 53% of respondents identify as Democrats and 43% as Republicans; the remaining 4% identify as independent, undecided, or affiliated with another party. These percentages are similar to those obtained in the first EdNext survey in 2007, when 53% identified as Democrats and 42% as Republicans.
In general, survey responses based on larger numbers of observations are more precise, that is, less prone to sampling variance than those made across groups with fewer numbers of observations. As a consequence, answers attributed to the national population are more precisely estimated than are those attributed to groups. The margin of error for binary responses given by the full sample in the EdNext survey is roughly 1.5 percentage points for questions on which opinion is evenly split. The specific number of respondents varies from question to question, owing to item nonresponse and to the fact that, in the cases of several items, we randomly divided the sample into multiple groups in order to examine the effect of variations in the way questions were posed. The exact wording of each question is displayed at www.educationnext.org/edfacts. Percentages reported in the figures and online tables do not always sum to 100, as a result of rounding to the nearest percentage point.
This article appeared in the Winter 2018 issue of Education Next. Suggested citation format:
West, M.R., Henderson, M.B., Peterson, P.E., and Barrows, S. (2018). The 2017 EdNext Poll on School Reform: Public thinking on school choice, common core, higher ed, and more. Education Next, 18(1), 32-52.