
Earlier this month I exposed the critical flaw in a recent Brookings Institution report that purported to show that Arizona families participating in the state’s K–12 education savings accounts (ESA) policy are disproportionately wealthy.
The Brookings researchers had failed to consider Arizona’s popular and longstanding tax-credit scholarship (TCS) policy, which works in tandem with Arizona’s ESA policy and disproportionately benefits low-income families. Considering the two policies together paints a very different picture of who benefits from education choice policies in Arizona.
The researchers, Jon Valant and Nicholas Zerbino, responded to my and several other critiques or contrary analyses, which they dismiss as “baseless, misleading, or just kind of odd.” Others can defend their own work, but their response to my critique is entirely unpersuasive. Once again, they fail to provide readers with key information they need to understand how Arizona’s ESA and TCS programs operate.
As I noted previously, low-income families can receive tax-credit scholarships that cover a greater amount of tuition than the typical ESA. Since the TCS and ESA programs work in tandem, and participation in one precludes participation in the other, it’s impossible to study their effects in isolation.
The Brookings researchers concede that the TCS programs exist alongside the ESA, and implicitly they concede that their omission would compromise their analysis if the TCS programs were substantial enough. But they argue that the TCS programs “are small relative to a large-and-growing universal ESA program” (emphasis in the original). They also observe that “most TCS dollars are going to recipients above 185% of the federal poverty level—the threshold for reduced-price lunch eligibility.” To illustrate this point, they provide this handy—but misleading—chart:
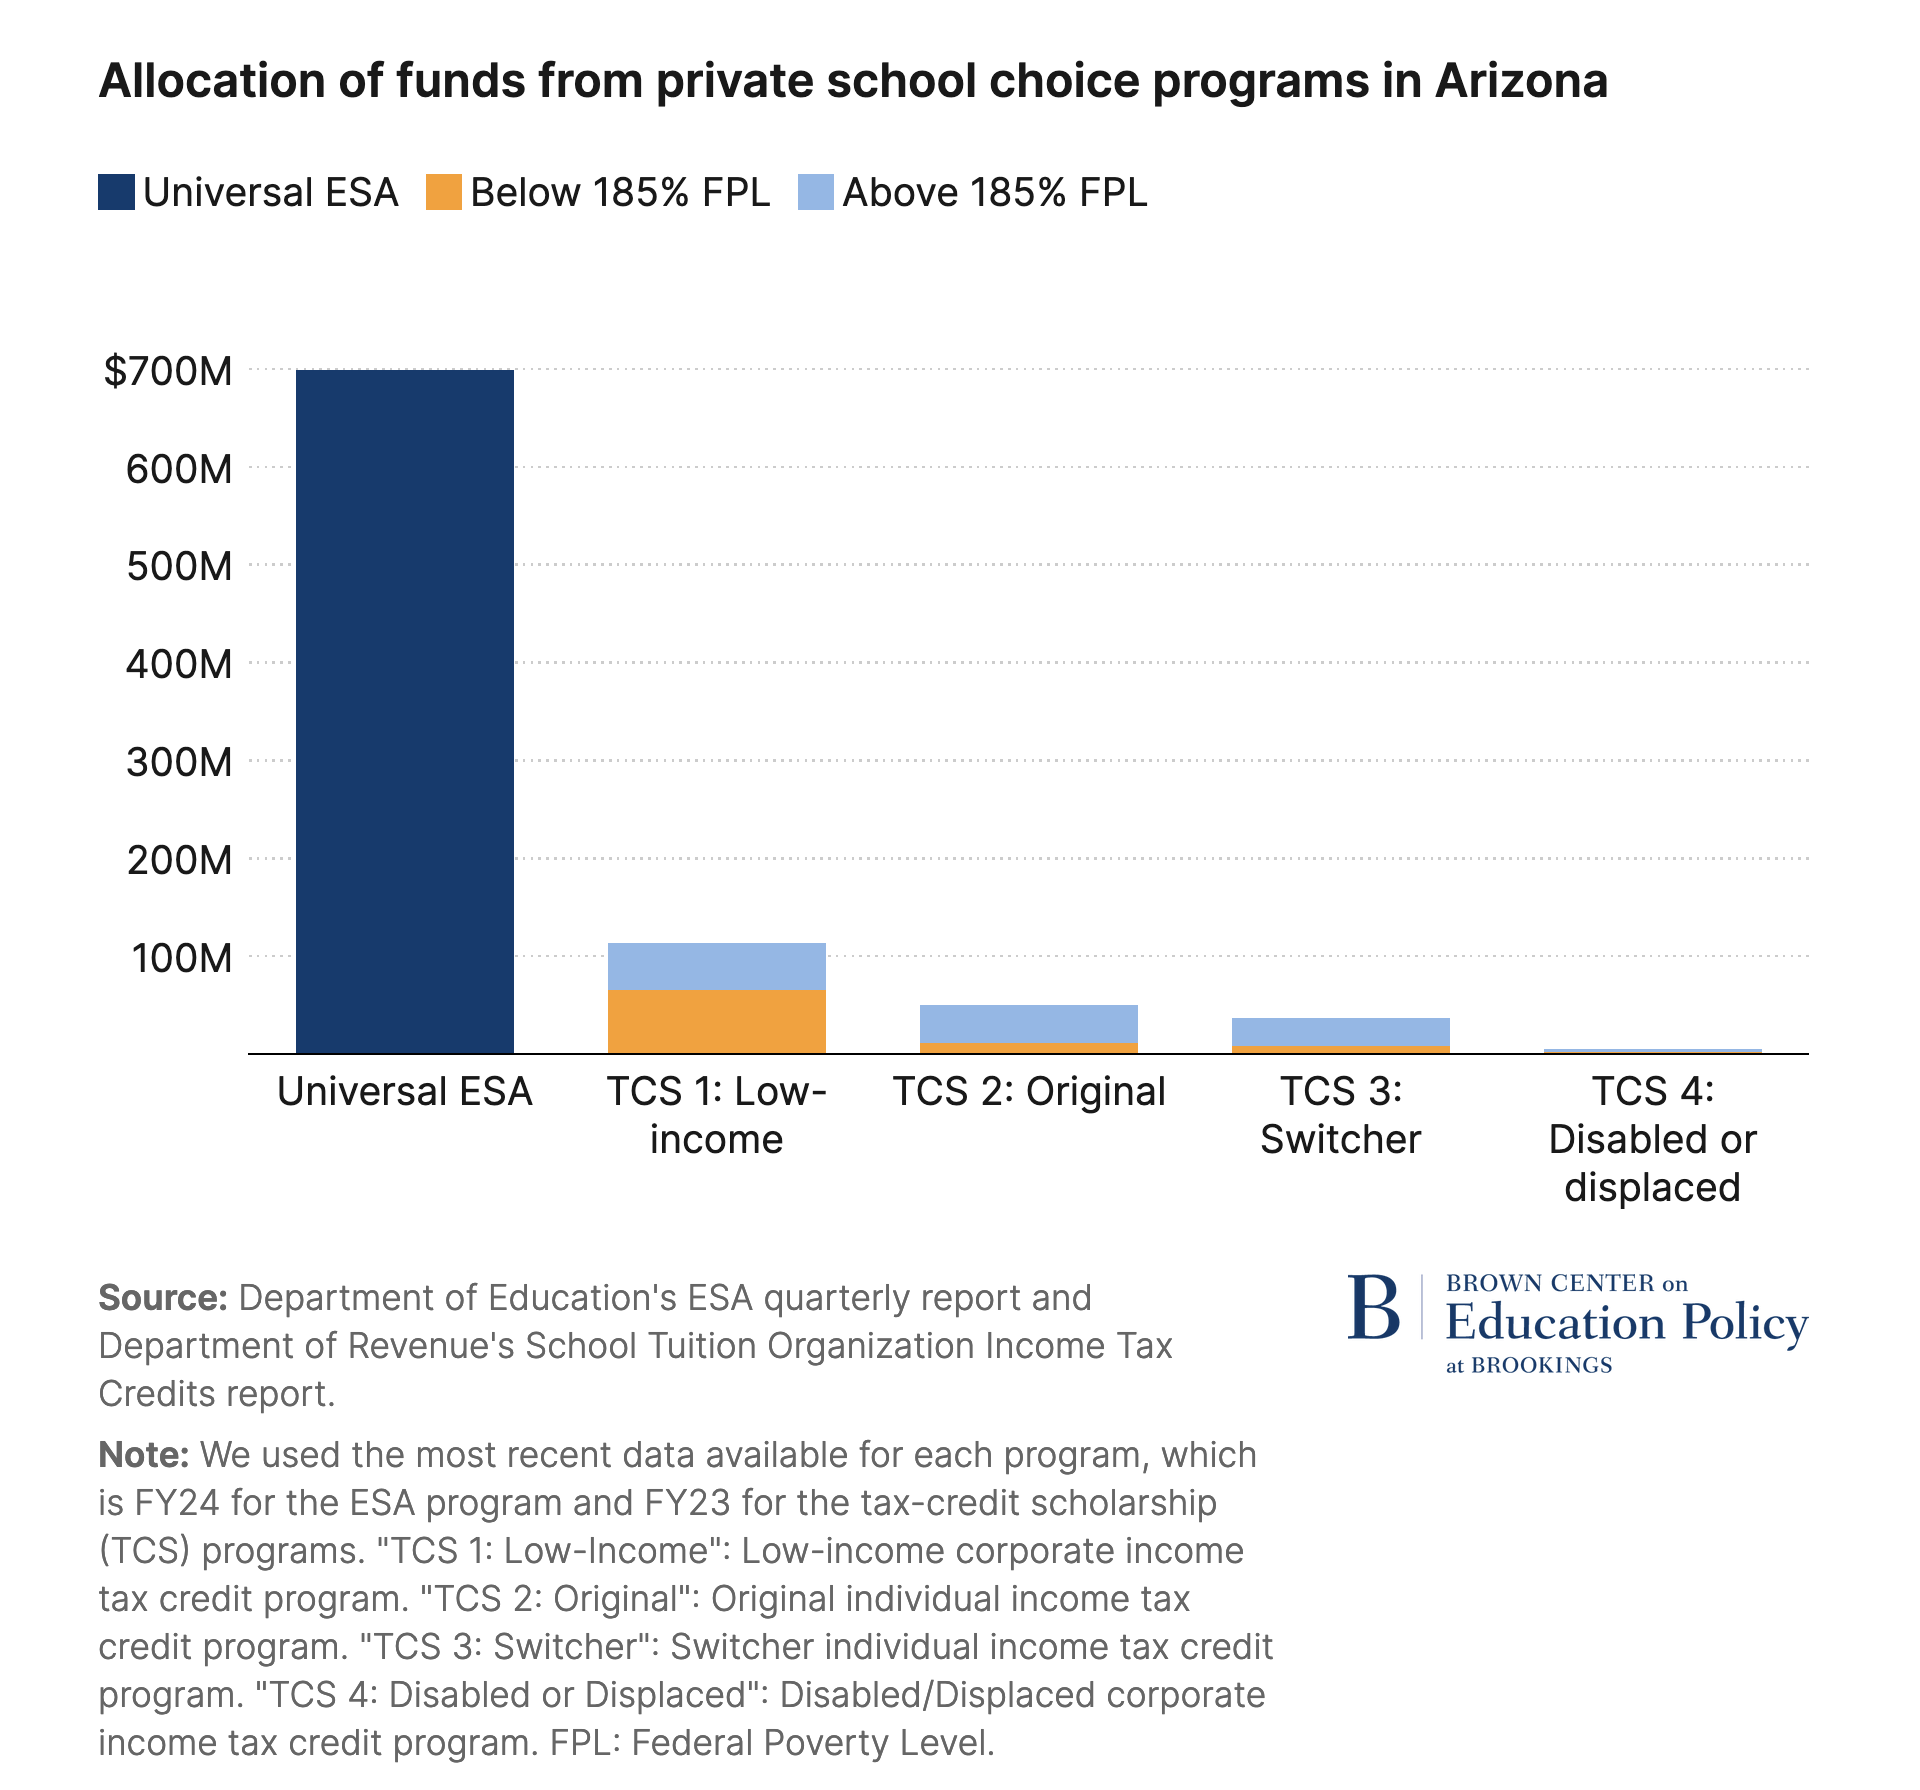
The Brookings researchers then conclude that my critique doesn’t “point to context that meaningfully changes the interpretation of our data.”
But their presentation of the data misleads readers in two ways. First, it inappropriately separates the TCS programs (which function as one program), and second, it does not distinguish spending on students with special needs (which is almost entirely in the ESA program). These misrepresentations make the TCS programs look smaller relative to the ESA than they really are for those whose children are not in need of special education.
Comparing Arizona’s education savings accounts and tax-credit scholarships
To demonstrate the relative sizes of the ESA and TCS programs, the Brookings researchers present data on their relative funding. At first glance, that is an odd choice, as the most relevant comparison would be ESA and TCS recipients. However, given that students may receive multiple scholarships, it’s not entirely clear how many scholarship recipients there are, so the programs’ relative funding might seem like a reasonable proxy.
However, it doesn’t make sense to break the scholarship programs into the separate categories Brookings employs. When a family applies for a scholarship from a scholarship organization in Arizona, they can receive funding from all four programs if they meet the eligibility criteria. Indeed, having spoken with dozens of Arizona scholarship families, I can attest that they often don’t even realize that there are technically four different programs. All they know is that the scholarship organizations ask them for certain information (e.g., household income, whether their child had previously attended a public school, and their foster care or disability status), and that, after verifying that information, they receive a scholarship. Rather than being represented by four separate bars in a chart, the TCS funds should be combined into a single, much higher bar to portray its magnitude accurately.
Moreover, the ESA funding data are heavily affected by spending on students with special needs, who account for 18% of ESA students and 41% of ESA funding. Whereas the median ESA student receives about $7,400 annually, students with special needs can receive considerably higher funding, depending on the funding weight accorded to their disability under Arizona law. According to the Arizona Department of Education’s quarter 2 ESA report for 2024, 6,261 ESA students with disabilities received more than $30,000 each. Given that they can receive so much more money from the ESA, nearly all the families of students with special needs use the ESA instead of the TCS.
Brookings failed to account for how families of students with special needs cluster in the ESA program, just as they had failed to account for how low-income families cluster in the TCS program.
If students with special needs are considered separately, and the three TCS policies that aren’t limited to students with special needs are combined, then the ESA program is spending about $434 million for students without disabilities, compared with $200 million of tax-credit scholarship funding, as shown in Figure 1. (Note that “Lexie’s Law for Disabled and Displaced Students” also serves foster students who do not have special needs, but I have separated the entire tax credit from the other three since it is impossible to tell how much money is going to students in each category, though it is likely that the vast majority goes to students without special needs.)
Figure 1
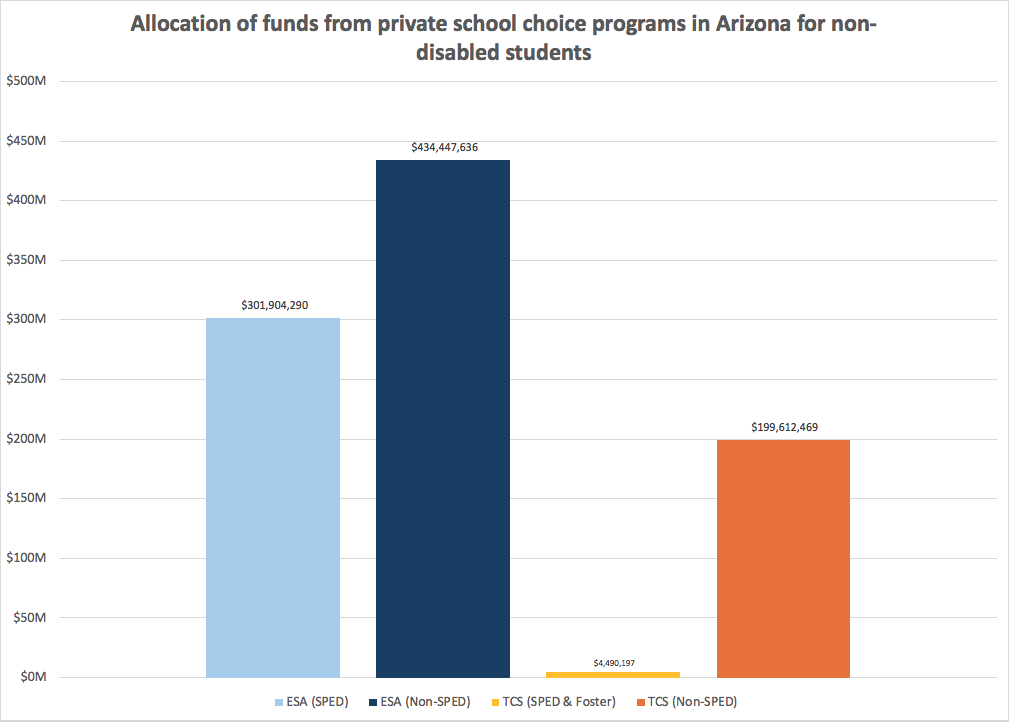
Sources: Arizona Department of Education and Arizona Department of Revenue’s School Tuition Organization Income Tax Credits 2023 annual report.
In other words, contrary to the Brookings researchers’ portrayal, the TCS program is not “small” relative to the ESA.
Tax-Credit Scholarships disproportionately benefit low- and middle-income families
The Brookings chart only distinguishes between TCS funding on students from families earning above and below 185% of the federal poverty level. About a third of Arizona families with school-aged children fall below that level. However, the Arizona Department of Revenue also reports how much funding goes to families earning between 185% and 342.25% of the federal poverty level, which is the eligibility threshold for Arizona’s corporate-funded TCS program. About a third of Arizona families fall in that category as well.
In other words, Brookings is comparing the bottom third of families against the top two. But what if we looked at the three categories separately? In that case, as shown in Figure 2, it becomes clear that low- and middle-income families disproportionately benefit from Arizona’s TCS program relative to higher-income families.
Figure 2
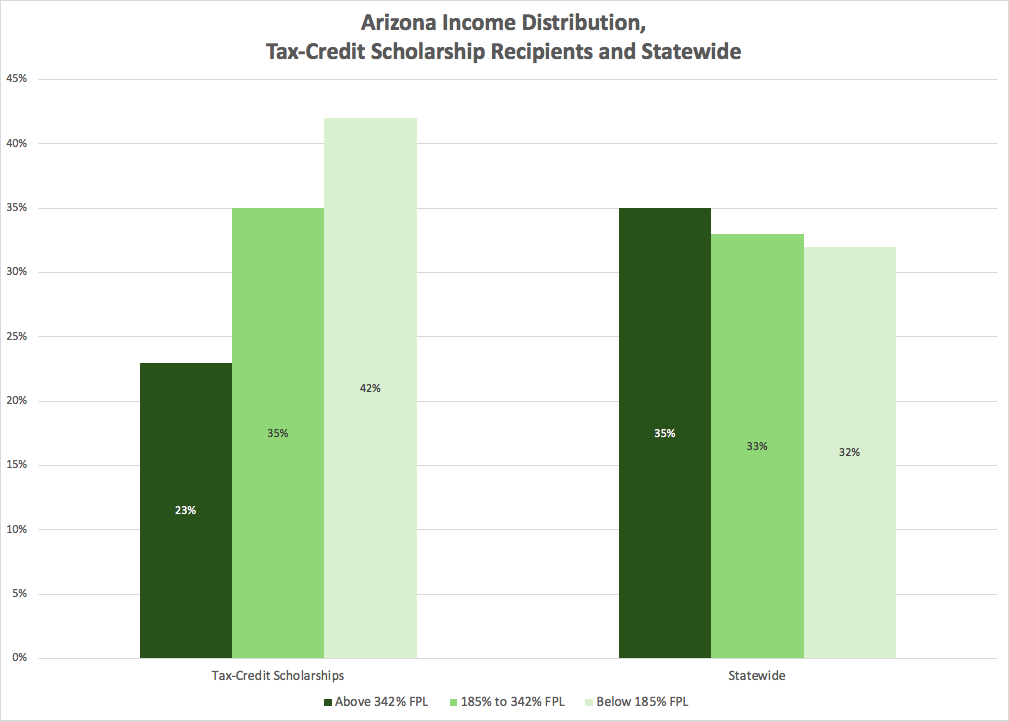
Sources: Arizona Department of Revenue’s School Tuition Organization Income Tax Credits 2023 annual report; U.S. Census Bureau, Current Population Survey (2022).
According to the U.S. Census, 32% of Arizona families with school-aged children earn less than 185% of the federal poverty level, and scholarship families in that income range receive 42% of TCS funding. Likewise, those earning between 185% and 342% of the federal poverty level represent 33% of Arizona families with school-aged children but 35% of TCS funding. Meanwhile, 35% of Arizona families earn more than 342% of the federal poverty level, but they receive only 23% of TCS funding.
Brookings characterizes this distribution by stating that “most TCS dollars are going to recipients above 185% of the federal poverty level.” One could also say that most TCS dollars are going to low- and middle-income families, and that low-income families disproportionately benefit the most. Readers can decide which statement more accurately captures the reality of who benefits from tax-credit scholarships in Arizona.
As I stated before, it’s impossible to assess whether Arizona’s education choice policies are “addressing inequities in school access,” as Brookings sought to do, without including Arizona’s popular and longstanding tax-credit scholarship policy in the analysis. Brookings has failed to present any compelling arguments or data to justify their omission.
Jason Bedrick is a Research Fellow at The Heritage Foundation’s Center for Education Policy.