
News reports routinely describe the teacher labor market as “dire” and “in crisis.” In recent years, influential media outlets across the country have described “unprecedented hardships” and “critical shortages” because, they report, demand for qualified teachers far outpaces supply.
But school leaders and researchers know there’s more to the story. Teacher shortages are not universal and staffing challenges vary widely by subject area and school type. Yet public understanding of teacher shortages typically lacks these nuances, and policymakers often don’t have detailed enough information to address schools’ needs.
What if there were a low-cost way to get a close-to-real-time snapshot of the demand side of the teacher labor market? Fortunately, there is: web scraping, an automated data-extraction technique that regularly exports and refreshes data from the Internet. Once set up, web scraping can quickly build and maintain updated data sets primed for analysis—and action.
We used web scraping to create a comprehensive database of teacher job postings in Washington State from late 2021 through 2022, updated Monday and Friday of every week. Our analysis shows that the scraped data is accurate in that it aligns with state administrative hiring data from that period. It also is timelier and offers new insights into teacher demand. Analysis of these data reveals that online postings for special education and English language learner teachers stay open weeks and months longer than those for elementary school teachers, two-thirds of which are filled within two weeks. Schools that serve the largest shares of Black, Hispanic, Native American, Native Hawaiian or Pacific Islander, and multiracial students—a combination we refer to as “underrepresented minority students”—have far greater hiring needs than schools with the smallest shares, and specialized openings remain unfilled for longer periods of time.
This new source of data has wide applicability at the state and district level. The teacher labor market is highly localized, and scraped job postings data can provide targeted and timely information for policymakers and education leaders. While states typically respond to teacher shortages with incentives to increase the overall supply of educators, ongoing analysis of job postings data can provide a detailed picture of demand and support precise strategies to shore up the teacher pipeline where and when it is needed.
Counting Teachers Isn’t Enough
Teacher shortages are a stubborn problem that tends to elicit a standard policy response: recruit more teachers. But this blunt approach, coupled with high rates of turnover, means recruitment is ongoing while actual staffing needs are not consistently met. “Given that shortages are most pronounced in specific settings, recruiting and retaining teachers is less about teachers generally and more about finding and keeping the right teachers, in the right subjects, for the right schools,” the Education Commission of the States advised its members in 2022.
However, current data systems don’t identify what subjects and schools are most in need. Rather than tracking teaching positions, most state data systems just track teachers. In a survey of 43 state education agencies published by the National Council on Teacher Quality in 2022, just one in four states had data tracking unfilled teaching jobs statewide and only about half of those states tracked that data at the school or subject-area level. The overwhelming majority of state education agencies don’t readily know whether districts need more physical education or physics teachers.
Many states are focused on increasing supply, including through new partnerships with fast-track credentialing companies that place trainees in paid classroom positions near the outset of the program. Companies like iteach and Teachers of Tomorrow are training aspiring educators in more than a dozen states. However, if these alternate-route programs are preparing elementary school teachers when schools need special education teachers, they may not address the most acute staffing needs.
By contrast, the State of Illinois has focused on meeting demand and committed to spend up to $135 million over three years through the Teacher Vacancy Grant Pilot Program. The program provides flexible funding to school districts to attract, hire, support, and retain teachers in whatever ways they see fit. Critically, district eligibility is based on their number of unfilled teaching positions as measured by job postings data gathered by the Illinois State Board of Education.
The limitations of most state data systems also limit how much we can know about market forces and teacher hiring patterns. For example, a 2020 study focused on Florida examined the relationship between teacher quality (as measured by value-added to student test scores) and hiring date to find that teachers hired during an economic recession were more effective at raising student test scores than teachers hired outside of a recession period (see “How the Coronavirus Crisis May Improve Teacher Quality,” research, Fall 2020). A 2023 study looking at unemployment and teacher certification and hiring rates in Massachusetts found similar patterns. In each case, however, the lack of direct evidence on demand for teachers makes it hard to assess whether the quality of new teachers improves during recessions because of changes in the supply of teachers (i.e., more talented individuals choosing the profession) or changes in demand (i.e., districts hiring fewer teachers and therefore becoming more selective).
A Test of Web Scraping
We decided to test out how well a low-cost technology can build a detailed data set of open teacher jobs and reveal specific pain points in a state’s teacher labor market. The technology, web scraping, is an automated way to extract data from the Internet and is increasingly used in the social sciences. Researchers first identify a set of websites that have the information they need, and then use programming languages such as Python or R to pull specific data from each website and export it to a standard format. Once set up, web scraping quickly produces and automatically maintains real-time data sets primed for analysis.
Our study focuses on Washington State, where we used automated web scraping to collect job postings for classroom teaching positions in 2021 and 2022. First, we test the accuracy of job postings data by comparing it to state hiring data. Then, we analyze our scraped data to identify differences in staffing challenges by subject area and district type.
Our efforts began with an initial pilot in fall 2021 to scrape job postings in the 242 school districts that had observable openings for classroom teachers. These districts enroll 98.5 percent of all public school students in Washington; the 53 districts not included are mainly in rural areas and did not publish postings online during the study period. We then scraped district sites twice weekly through the end of December 2022.
To test the accuracy of job postings data, we compare the subset of scraped postings that appeared online between October 2021 and October 2022 with state administrative data on new teacher hires. Web scraping over the 12-month period observes 12,273 teacher jobs posted and 10,723 removed, suggesting that the jobs were filled. During that same period, state administrative data identifies 10,629 new hires for classroom roles in school districts. In a regression framework in which a one-to-one posting-to-hire ratio implies a perfectly aligned measure, we find a relationship of 0.91 at the district level. That is, posting one job at a school district is associated with an increase of 0.91 hired personnel, which confirms that the two measures are well aligned. In matching postings with new hires at the school level, the relationship is 0.56. Each new posting is associated with 0.56 newly hired teachers, likely because some new hires at schools are based on within-district transfers for which no job posting appears.
To gain insights into what sorts of jobs are most challenging for schools and districts to fill, we look at a full calendar year of scraped data, from December 2021 to December 2022, and group open positions into five categories. Teacher job postings are categorized as elementary, special education, STEM (science, technology, engineering, and math), and English language learner, which are the four most common areas of subject endorsement in Washington. All remaining teacher openings are categorized as “other.”
Then we look at monthly total postings for each subject area by school to observe how the volume and duration of postings varies within districts, across subjects, and over the course of the calendar year. To examine how postings vary by district demographics, we include data on districts, schools, and teachers from the Washington State Office of Superintendent of Public Instruction.
Differences by Subject Area and Student Demographics
Our findings largely reflect those of earlier research: teacher shortages, hiring, and turnover vary by subject area, district, and school. However, web scraping technology provides new insights. For example, by tracking open postings over time, we observe not only differences in the number of postings at the school level, but also differences in the length of time that job postings stay open—a data point that is only observable when we collect when positions open and close.
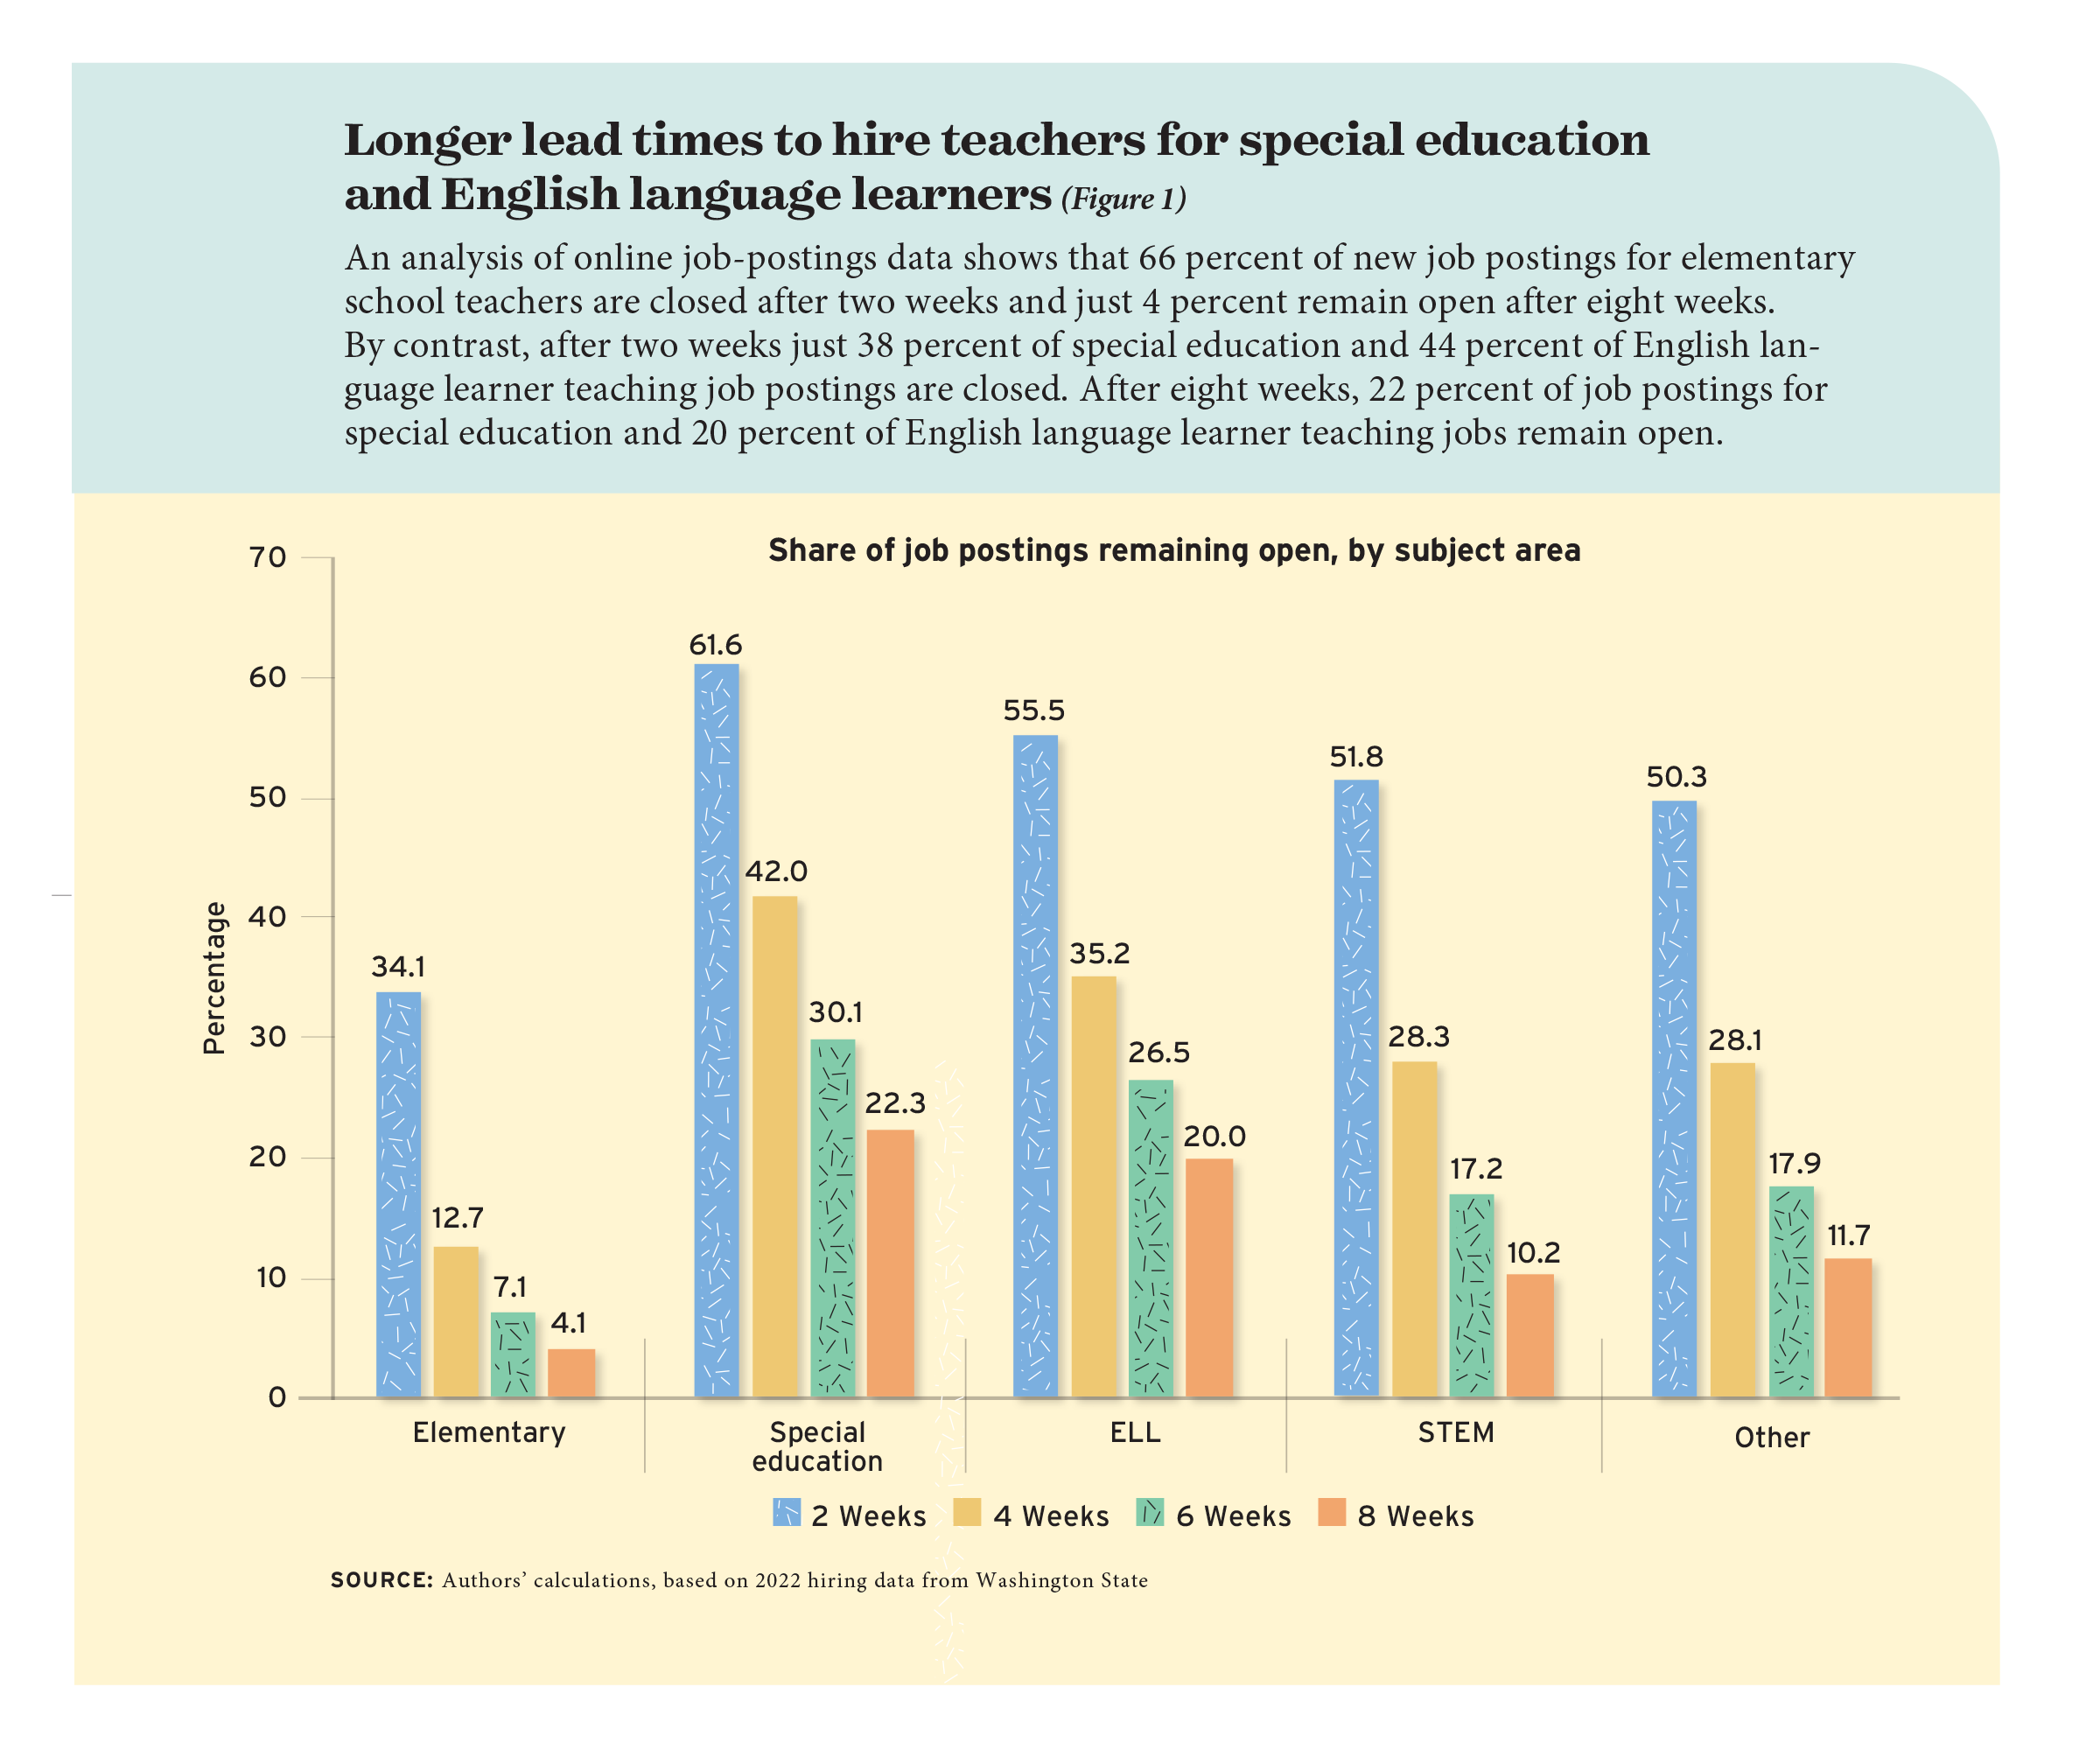
Openings for elementary school classroom teachers fill more quickly than all other subject areas, while job postings for special education teachers remain open the longest (see Figure 1). Within two weeks, about 66 percent of elementary teaching job postings are removed, compared to 38 percent of special education postings and 45 percent of postings for teachers of English language learners. By the eighth week of a job posting being online, only 4 percent of elementary positions are still posted compared to 23 percent and 20 percent in special education and English language learner jobs, respectively.
We also look at differences in job postings by student demographics. We group schools into quartiles based on their percentage of Black, Hispanic, Native American, Native Hawaiian or Pacific Islander, and multiracial students; those with the largest shares of underrepresented minority students post more job openings every month throughout the year compared to schools with the smallest shares. Job postings also start increasing earlier in the year, with dramatic increases in March and May.
While such differences may not be particularly novel or surprising, job postings data also detail the extraordinary challenges in hiring that these schools face. Hiring needs for elementary teaching positions are relatively similar among schools serving the greatest and smallest shares of underrepresented minorities—the difference is equivalent to 1.7 more open jobs per 100 full-time employees in the highest-need schools. By contrast, differences in job postings for special education and English language learner teachers are far larger, especially in the spring months. In spring, schools with the largest shares of underrepresented minority students are seeking to hire more than twice as many credentialed teachers to fill special education and English language learner positions than schools with the smallest shares. For English language learner teachers, the difference is equivalent to 12.8 more jobs per 100 employees, or seven times larger than the gap in hiring for elementary school teachers.
Because these data allow us to consider openings at individual schools over time, they also show which jobs stay open the longest. This provides a clear picture: at schools that serve large shares of underrepresented populations, students who are entitled to special education or English language learning services are going for longer periods of time without instruction by a credentialed teacher. While prior analyses based on emergency credentials or out-of-field teaching have pointed to similar findings, the durations of open job postings provide a potential new equity measure and a direct, immediate signal of unmet demand in the teacher labor market, with clear implications for research and policy.
EdNext in your inbox
Sign up for the EdNext Weekly newsletter, and stay up to date with the Daily Digest, delivered straight to your inbox.
New Insights and Opportunities
Web scraping is relatively inexpensive, disaggregates job postings by subject area, and can capture data twice a week. Because job postings are available at this frequency, they provide a clear, nuanced, and timely signal of school staffing needs.
The importance of timeliness cannot be overstated, especially when considering traditional data reporting and state legislative calendars. In Washington State, legislators conclude their work by late April, or sooner, each year. In spring 2023, for example, any state funding or policy decisions aimed at addressing teacher staffing challenges in the 2023–24 school year would have been based on data from 2021 (a May 2021 report on teacher shortages and the state education department’s 2021 report card) and early 2022 (the national teacher shortage survey from 2021–22). Data from job postings would have provided a detailed snapshot from the fall of 2022—more current by almost a full year.
The timebound nature of scraped job postings data also sheds light on school and district hiring processes as they relate to teacher quality. Research has shown that late hires, which happen in late summer or early fall, can be detrimental to student learning. Observing when districts post open jobs can signal whether they are engaged in early hiring, late hiring, or something in between, where the difference can mean new teachers have months to prepare or are scrambling to get their footing after the school year has already begun. Such information could inform policy and targeted supports for more effective management practices.
Job postings data can also serve as a ready measure of policy impact. State personnel data tell us when new people are hired, but those data are generally not available until the following school year. This lag is limiting when policymakers are facing immediate issues, such as the imminent expiration of federal Covid-era relief funding. For example, in a separate analysis, we looked at scraped job postings data in Washington State to determine the impact of federal ESSER (Elementary and Secondary School Emergency Relief Fund) dollars on school staffing. That analysis found that 12,000 school staff and roughly 5,100 teachers were hired statewide with ESSER funds—suggesting that district budgets will likely face cuts when the funds are gone.
Scraped job postings data do not capture everything education leaders and policymakers need to know. Job postings data don’t show the share of teachers working out-of-field or with emergency credentials, or illuminate trends in teacher retention, diversity, or quality. However, the data can serve as an important accompaniment to traditional data collection.
Many states are currently investing millions of dollars to support new pathways into the teaching profession; scraped data could steer investment toward subject area and school types most in need of new teachers. Incentives such as loan forgiveness, bonuses, housing stipends, and salary boosts could also be directed toward districts that struggle to hire sufficient staff. Such policies have helped address shortages in the past; for example, in Hawaii, a $10,000 bonus program for new special education teachers reduced vacancies by 32 percent, research by one of us (Roddy Theobald) has found. States could also use scraped data to coordinate with undergraduate institutions to recruit students in shortage areas like STEM to pursue a teaching credential. Additionally, typical counts of unfilled classroom jobs tend to overemphasize the shortage of elementary teachers, which are the largest share of the workforce, and understate the immediate needs for special education and STEM teachers, who are employed in smaller numbers overall.
Common sense and job postings data tell us that teacher shortages are multifaceted and complex. There are multiple, distinct challenges to bring credentialed educators into the classroom based on subject area and school type, and hiring enough qualified candidates will require a variety of inputs and incentives. Web scraped job postings data highlight inequities in teacher demand and supply that go beyond what is captured in administrative data, and they appear to be a valid signal of district and school hiring needs. This low-cost, timely method of data collection can provide vital information to policymakers and educators who hope to address systemic inequities in public schools.
Dan Goldhaber is director of the Center for Analysis of Longitudinal Data in Education Research (CALDER) at the American Institutes for Research and director of the Center for Education Data & Research at the University of Washington, where Maia Goodman Young is research manager and Grace Falken is a research consultant. Roddy Theobald is managing researcher and deputy director of CALDER at the American Institutes for Research.
This article appeared in the Fall 2024 issue of Education Next. Suggested citation format:
Goldhaber, D., Falken, G., Theobald, R., and Goodman Young, M. (2024). A Better Measure of Teacher Shortages: Web scraping job postings pinpoints challenges in real time. Education Next, 24(4), 32-37.