I was a sophomore in high school when my dad told me about an up-and-coming public charter school called Design Tech High in Burlingame, California, about 30 miles north of my hometown in Silicon Valley.
From the age of five I had attended my small-town public schools. I was comfortable there, but the only approach to learning I’d ever known was pretty dull: read the textbook, do the homework, take the test. No questions asked. For me, it was a monotonous routine with little personal meaning.

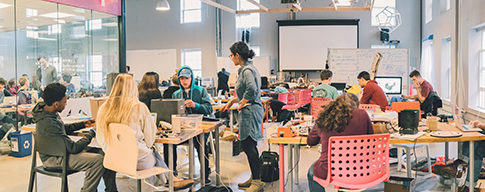
I wanted to know more about this school centered around “design thinking,” so I went to shadow a student for a day. The school was located in a warehouse filled with student work—woodworking projects, paintings, and expressive collages. The use of design thinking was evident in every corner: ideas jotted on sticky notes and posted everywhere, and whiteboards covered with words and sketches. I was excited about the prospect of taking their one-of-a kind Design Lab class—where I would learn and apply the design thinking process—along with more standard courses like language arts and U.S. history.
I wanted to do work I was passionate about, so I decided to venture into the unknown and unorthodox style of learning at Design Tech: I became a “d.tech dragon.” The concept of design thinking felt foreign to me at first. I was now being asked to think practically, looking at the world through the eyes of an innovator. That meant making use of both creativity and analysis, and following sequential steps: empathizing, defining, ideating, prototyping, and testing.
I got to try out the new thinking skills I was developing in my first intersession, a two-week period in which students put aside their usual academics and take classes focusing on extracurricular activities, design thinking, and real-world skill building. I took “Data Visualization,” a class hosted by the Oracle Education Foundation. Every morning I would go to sleek, tall glass buildings to learn about big data and what it takes to make a powerful data visualization. On the first few days we watched TED Talks and heard an in-person lecture by Cole Nussbaumer Knaflic, a data visualizer and author of Storytelling with Data, who taught us about the difference between pretty visualizations and meaningful ones. We also participated in a video chat with the CEO of the Dian Fossey organization. I was surprised to learn that, although their research takes place in the natural world, the scientists often make use of sophisticated technology—for example, to track gorilla types, counts, and habitats. It made me realize that data truly are everywhere.
Then we began our own projects, splitting into groups and brainstorming topics. I suggested that we research Alzheimer’s disease, having seen a family member experience it. My group was intrigued, and we decided to research emotional states of Alzheimer’s patients to help caregivers with their challenging work.
We divided up the tasks of collecting data, visualizing it, and creating a presentation. I worked on the visualization, using a software program called Tableau. I would import files and play around with colors, shapes, and design to create a visualization. The task proved challenging. I would make one visualization and realize that a different type of chart might be easier to read, or that the style I chose was impractical.
After trying many prototypes, we settled on a visualization that wasn’t very intricate or pretty but was simple and easy to understand: an animation and line graph showing changes in emotional states of Alzheimer’s patients over time. Our presentation at the end of the workshop also incorporated storytelling through poems that expressed the feelings of Alzheimer’s patients. One of the poems read, “I am sad and sick and lost. All I know is that I need you.” Looking into the audience of students, instructors, and family members, I felt they were genuinely moved by our presentation.
By the time I finished my first intersession, I had gained both confidence and a passion for technology. Later, my confidence blossomed further when I was chosen to be a TA for the data visualization class and learned how to be an effective leader among my peers. Through my experiences at Design Tech, I have had the chance to harness the power of design thinking not only to help solve problems in the real world but also to grow as an individual.
Meghna Gaddam is a junior at Design Tech High School whose interests include journalism, neuroscience, and advocating for more girls to enter the tech field. She hopes to go into medicine and work on health issues in impoverished communities abroad.
This article appeared in the Spring 2017 issue of Education Next. Suggested citation format:
Gaddam, M. (2017). How I Became a D.tech Dragon: Learning to think in a new way. Education Next, 17(2), 96.