
Last month wrapped the $190 billion federal investment from the Elementary and Secondary School Emergency Relief Fund, or ESSER. Just recently, two different research groups found that the money has produced some math and reading gains, but not nearly enough to address pandemic-era learning gaps. The researchers suggested that, at the current rate of return, 5–10 times the dollars or more were needed.
Truth be told, another massive financial windfall isn’t in the cards. So, what happens now? Does the end of ESSER mean test scores stay stuck at 2024 levels? Or is it possible to get better outcomes for the dollar so that learning recovery can continue when ESSER is gone? Notably, both of the recent ESSER studies posited that the ESSER money could have mattered more than it did.
We’ve been studying this massive ESSER experiment for clues about how school spending could deliver more for students, in part because the relationship between spending and outcomes has been—how to put this—frustratingly uneven. Many districts did indeed produce impressive recovery. But in others, the results have been the opposite, with test scores continuing to fall even as large sums flowed.
One thing is clear: there are no silver school-spending bullets. ESSER funds came in the form of a blank check. Where we have data, we find that how a district spent its funds doesn’t explain differences in test score gains. For instance, California data indicates that districts that spent more on tutoring didn’t see greater improvement than peers that didn’t deliver any tutoring. In Illinois, investing more in staffing didn’t guarantee improved outcomes, especially for its highest-poverty students.
Lawmakers looking for a high-leverage investment might be tempted to prescribe how districts spend their funds. But two otherwise similar districts can spend money on the same inputs and get wildly different results. The ESSER experiment reconfirms the notion that converting dollars to outcomes is so much messier than following a simple spending recipe.
So how can school systems continue to drive learning gains as ESSER ends? We’ve been analyzing the data and engaging with leaders to understand how systems might get more return on the dollars they have. Our findings point to five lessons on making money matter more in schools:
1. State leadership appears to matter. Interestingly, states seemed to play a role in the extent to which ESSER delivered test score outcomes. As the two panels in Figure 1 indicate, districts in states like Mississippi, North Carolina, Ohio, and Tennessee saw greater return in both reading and math scores for the ESSER dollar.
ESSER Spending and Learning Outcomes Varied by State (Figure 1)
Districts in some states saw more academic improvement for the ESSER dollar than in other states.
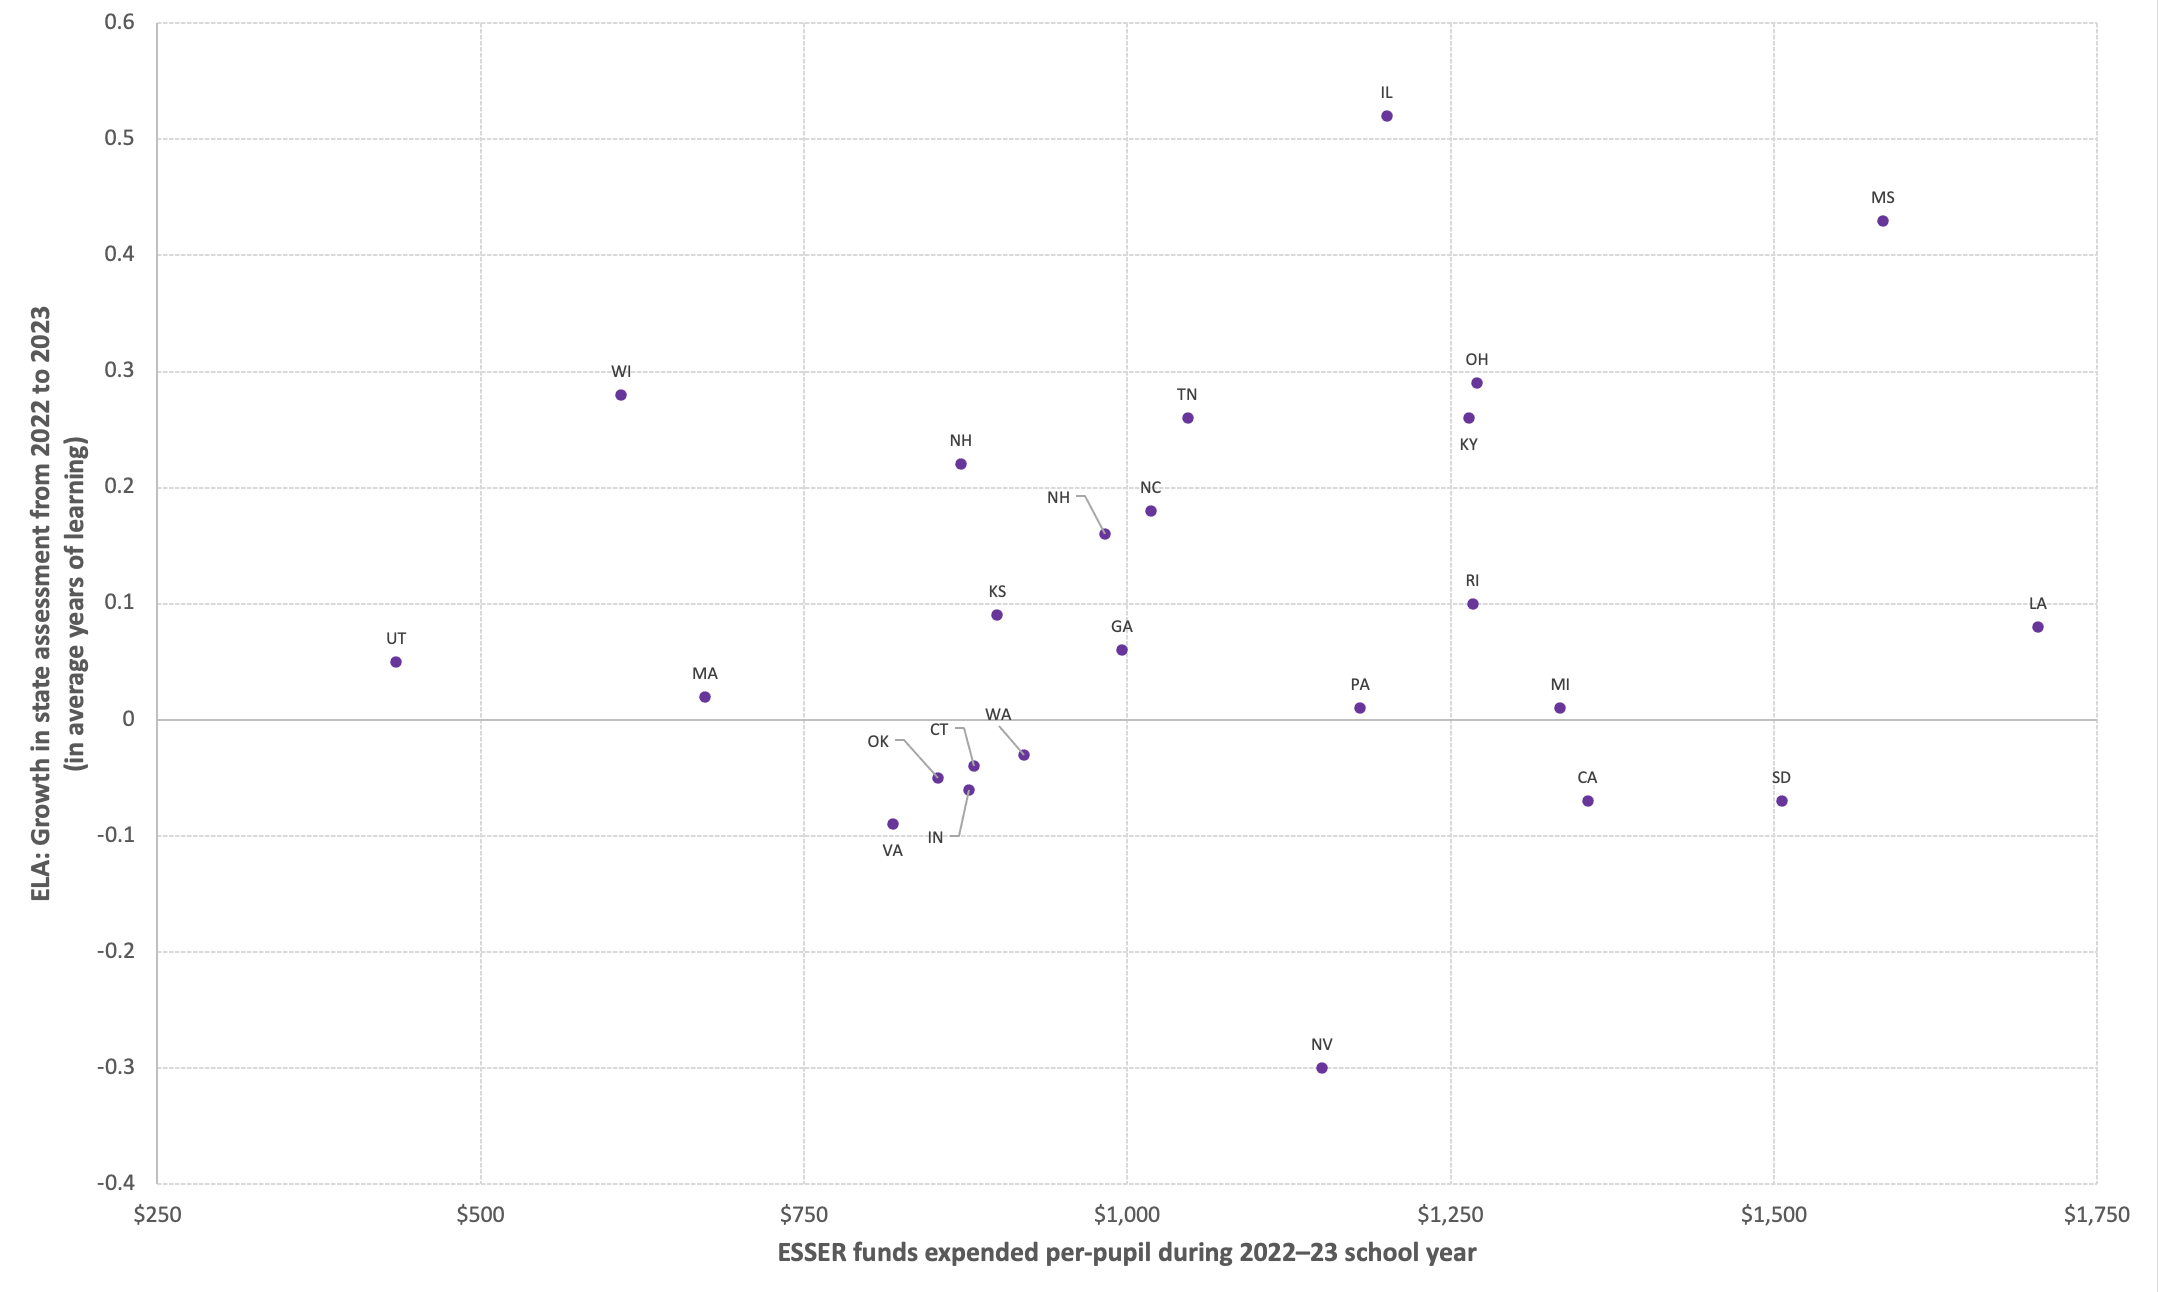
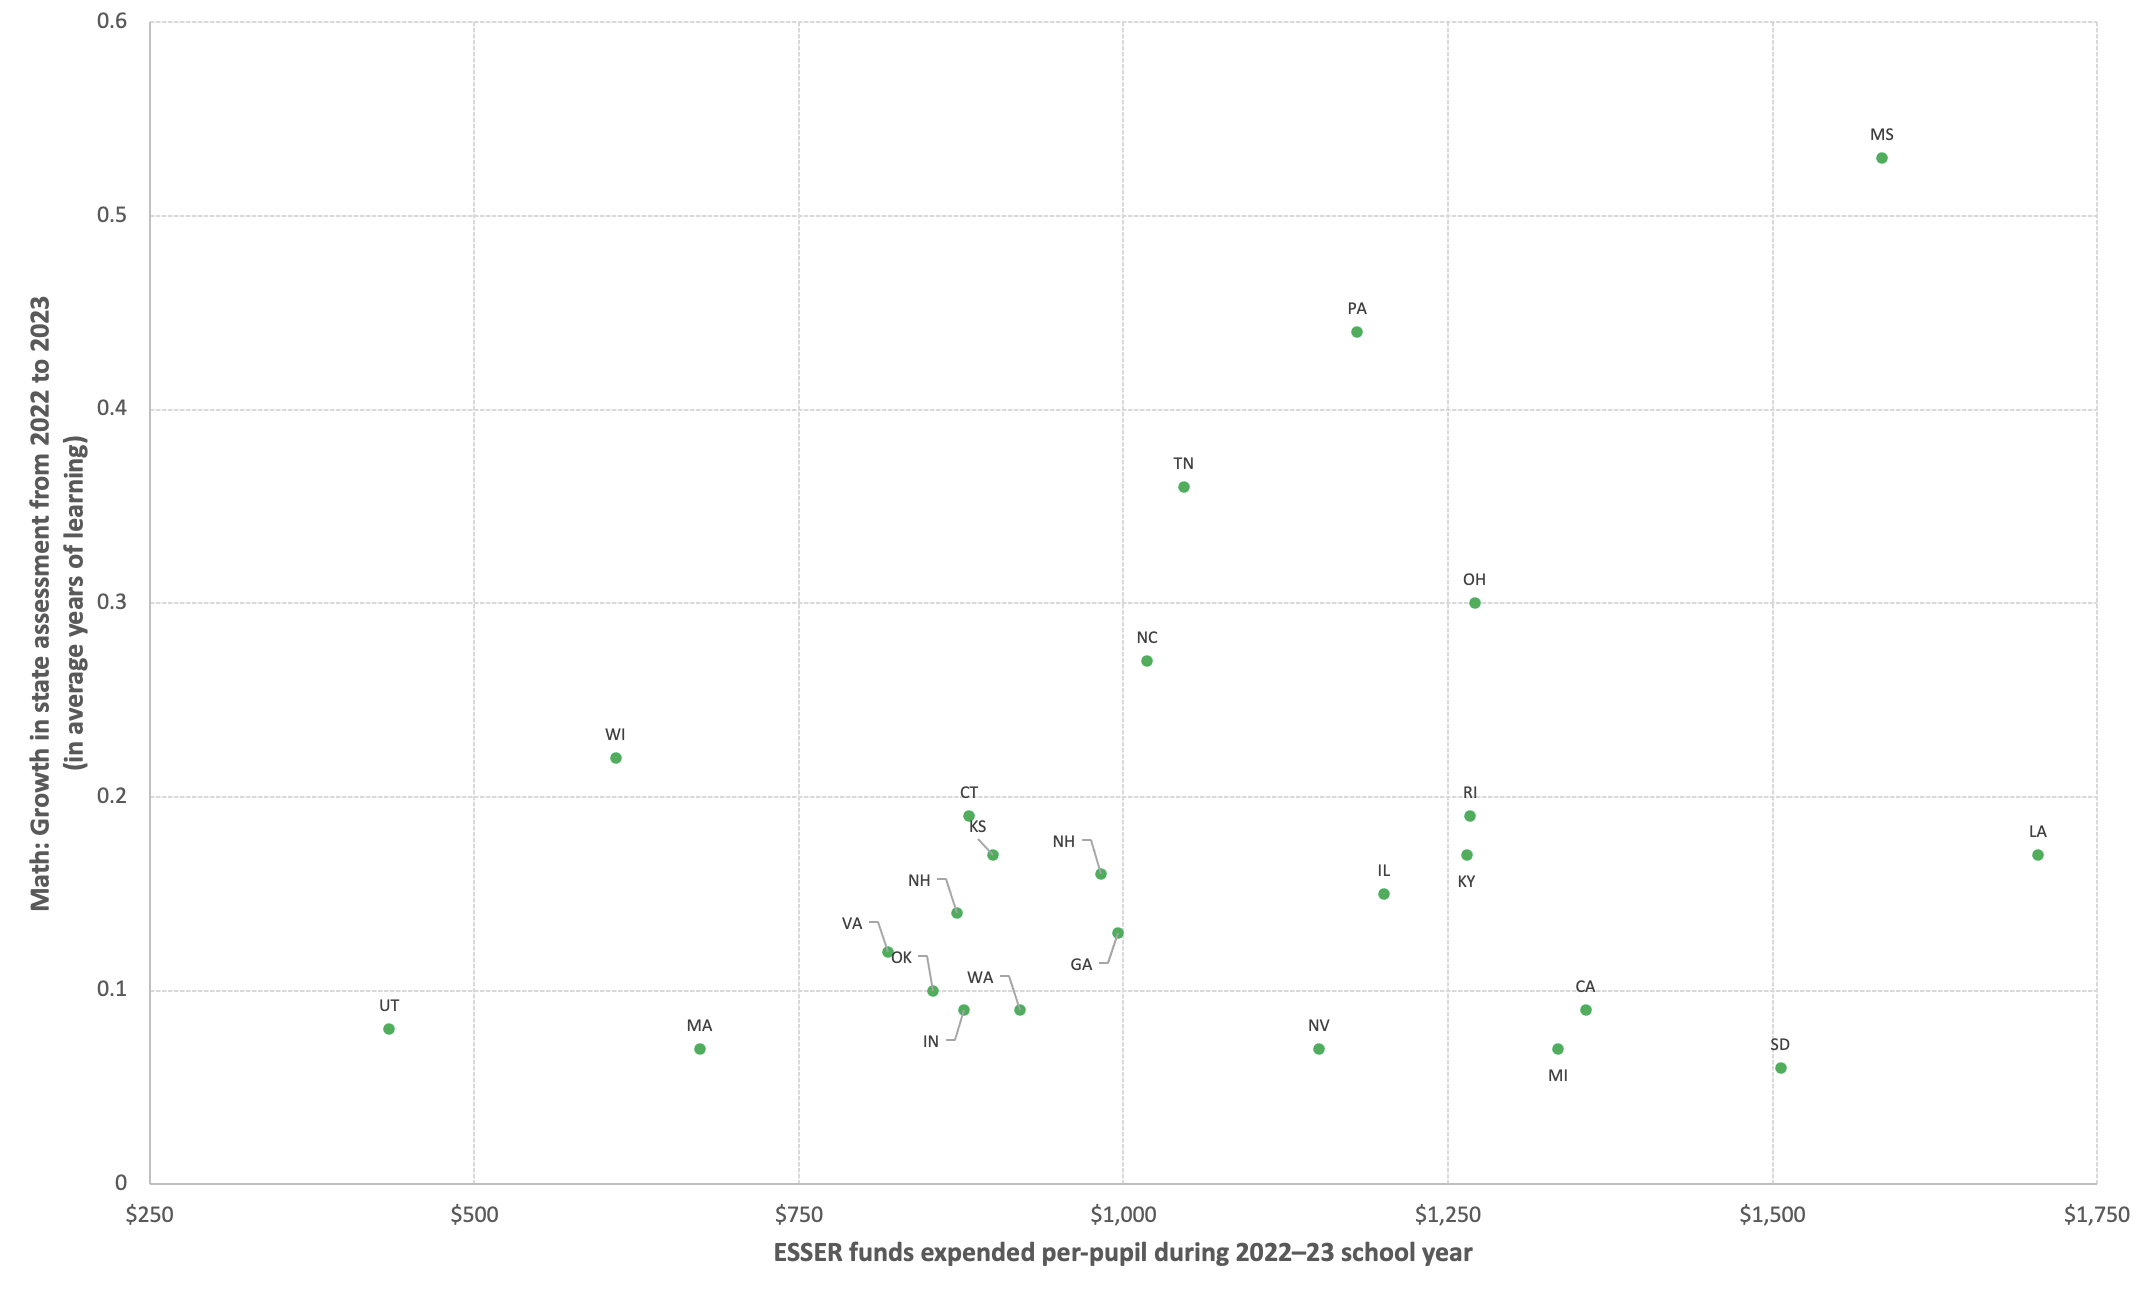
Source: Edunomics Lab Analysis using: ESSER spending data from Education Stabilization Fund, enrollment data from NCES Common Core of Data, and outcomes data from EdOpportunity.
What is it about the states that showed the greatest improvement? After ruling out factors such as how funds were spent, state spending prescriptions, staffing levels, length of closures, prior scores, and so on, our hypothesis is that leaders in those states were simply more effective at steering districts to focus on student learning. Recall that ESSER came without much of a mission statement beyond reopening schools or any expectations for measurable student outcomes. (And remember, Congress had already walked back its larger accountability structure in 2015 with the Every Student Succeeds Act.)
That void left district leaders on their own to decide what they hoped to get from the one-time funds. Some focused on learning recovery, but some pursued other goals: workforce diversification, air quality, pay raises for hourly workers, school safety, electric school busses, and so on. These can certainly be worthy objectives, but they competed with student learning.
That’s where it appears state education leaders may have had a real effect. For example, education commissioners Catherine Truitt, Carey Wright, and Penny Schwinn, (NC, MS and formerly TN) emphasized reading and math over other agendas, were clear about what constituted success, and measured progress along the way. In other states, districts were on their own to set priorities, while state leaders buried data and brushed off lackluster results.
Looking ahead, governors, legislatures, and state education agencies wanting to see more academic improvement for the dollar might look to fill the accountability void with a strong statewide focus on measuring and delivering progress on student outcomes.
2. Inequities hardwired into many large districts may have stalled progress in higher-poverty schools. ESSER was distributed via the Title I funding formula, which meant higher-poverty large districts got double or more funds per pupil than wealthier large districts. But here’s the rub: many of those large districts then disproportionately boosted spending in their wealthier schools.
Twenty of California’s largest districts augmented site-based spending in their wealthiest schools by 14–16 percent, versus just over 12 percent in their neediest schools (see Figure 2). In talking to leaders in larger districts, we heard that this happens when open positions get filled in wealthier schools first, sometimes drawing candidates from higher-poverty schools where vacancies then take longer to fill. Where ESSER fueled percentage-based pay raises, more dollars landed on schools with more senior teachers commanding higher pay—which were often more affluent schools.
Neediest Schools Shortchanged in California (Figure 2)
Higher needs elementary schools in 20 of California’s largest districts saw the smallest growth in spending from 2019–20 to 2022–23.
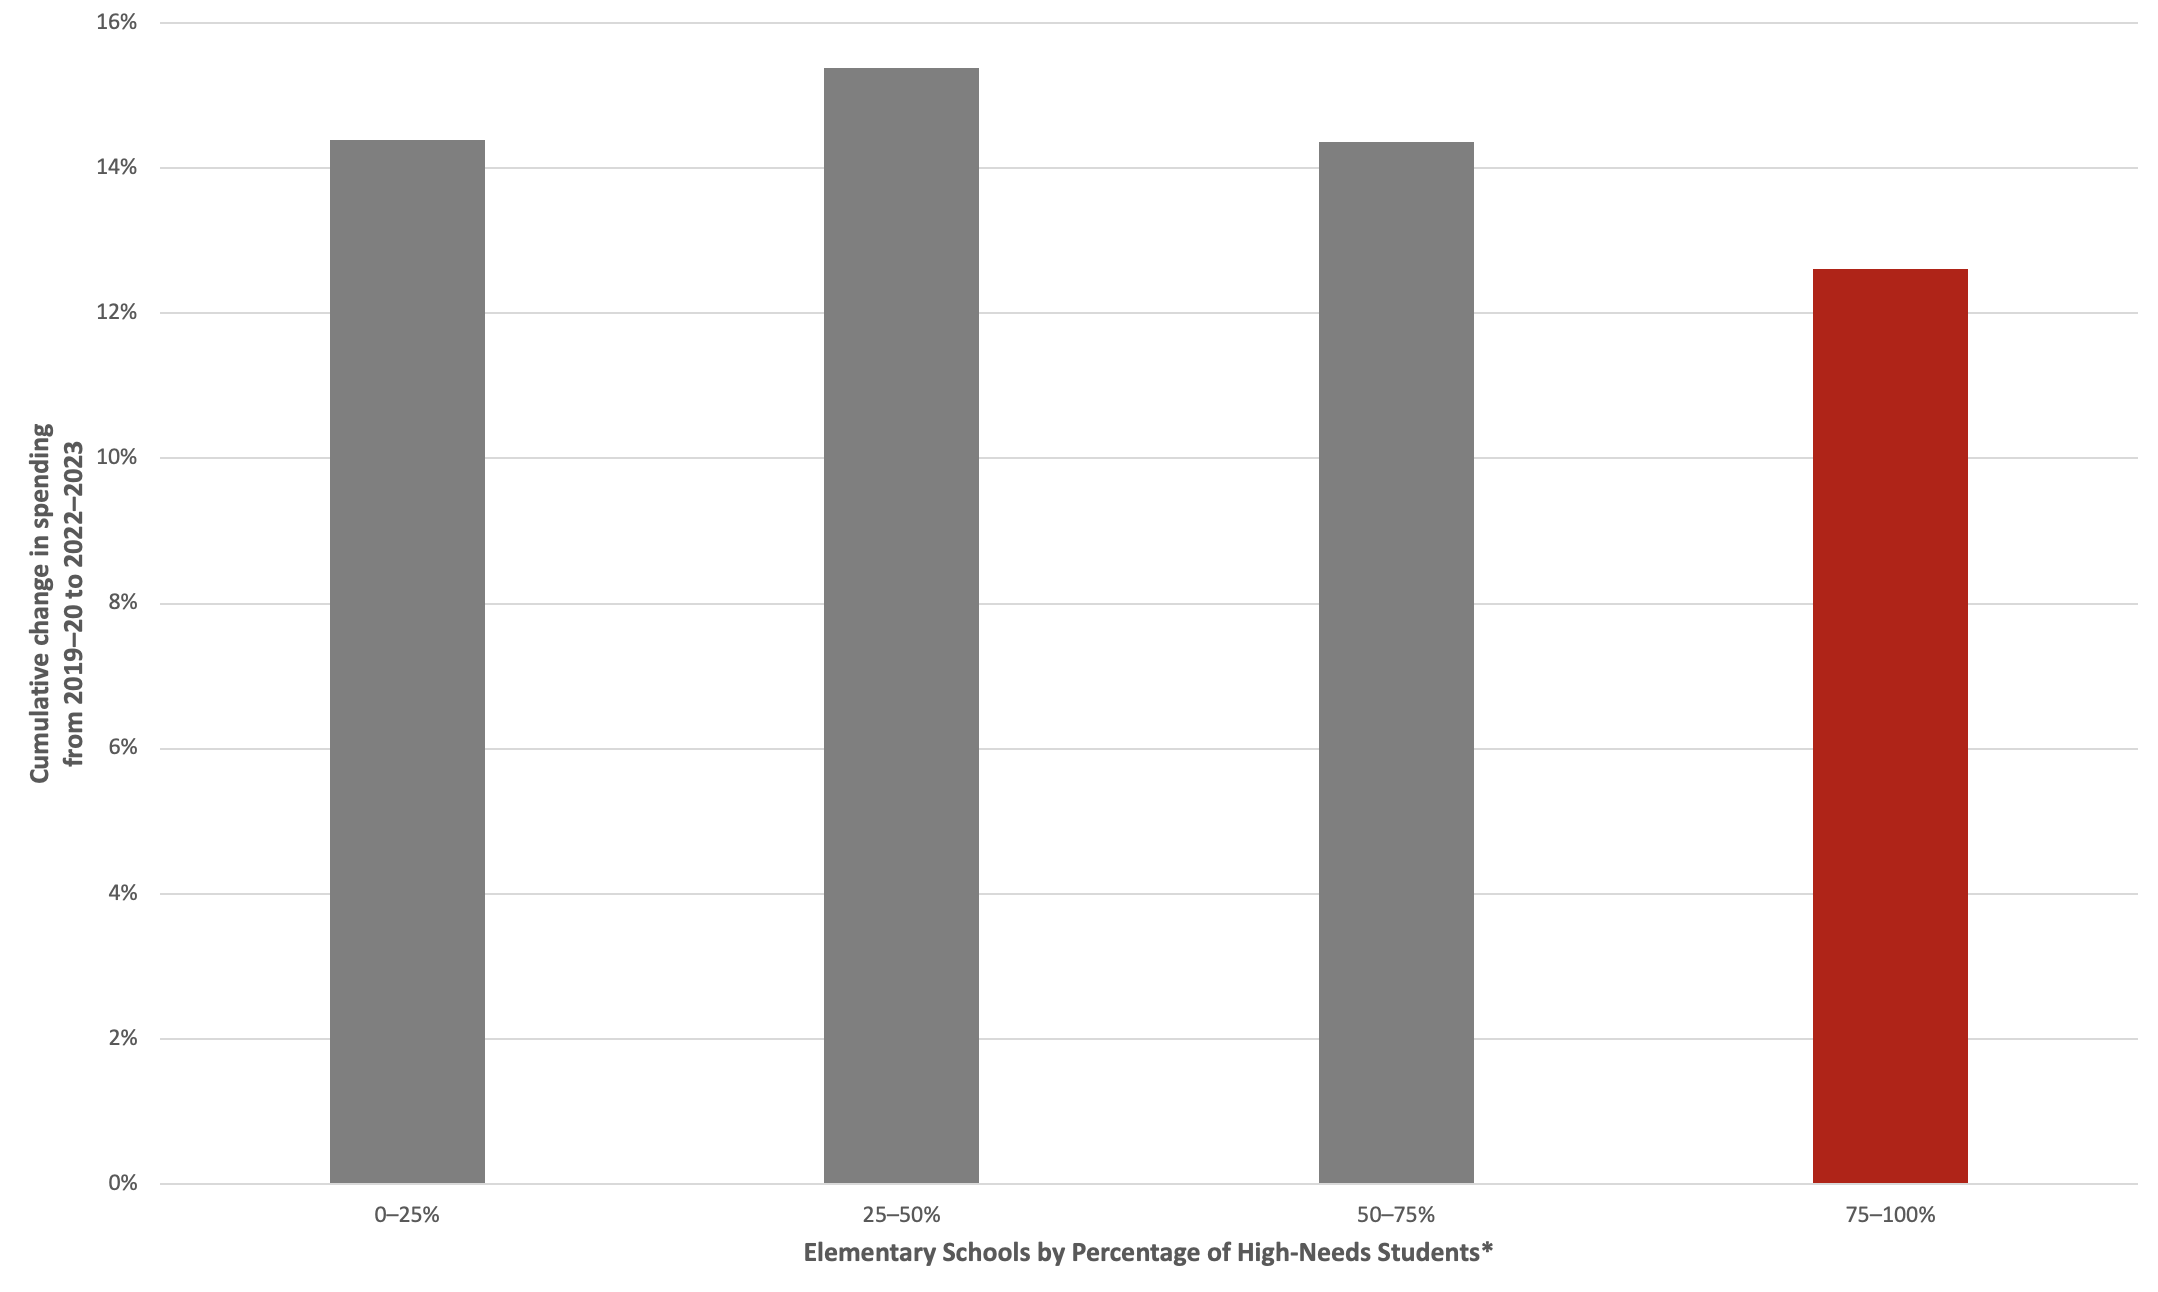
*High-needs students in California are categorized as an Unduplicated Pupil Count of students eligbile for Free or Reduced Price Meals, classified as English Learners, or identified as Foster Youth.
Source: Edunomics Lab Analysis using spending data from CA SACS and demographic data from CA Data Quest. Note: Analysis does not include LAUSD.
These same patterns popped up in other states’ large districts, suggesting the trend is likely an artifact of typical staffing and compensation schemes that have historically shortchanged our neediest schools.
Leaders wanting to ensure that funds help their highest-needs schools may need to reconsider reliance on these ingrained practices. Targeted pay for teaching in a higher-poverty school, for example, is a strategy that’s worked elsewhere.
3. Districts could get more value from procurement contracts. We estimate that some 20–30 percent of ESSER went out the door via contracts for things like purchased services, tutoring, or interactive tech-based tools that offer students more customized practice on math problems.
Yet the procurement market doesn’t work well. Buyers lack information. Vendor selection can depend on who you know. Price and value are rarely weighed together. Purchasing processes are cumbersome. Contracts aren’t monitored regularly for impacts. Vendors often bemoan that they can’t get districts to respond on implementation challenges.
In short, these contracts deserve more attention than they’re getting. States can help surface more effective vendors. Districts ought to ensure their services deliver real value for students by writing a smart contract with clear expectations, then monitoring data on implementation and results after it’s signed.
4. Special education is not a cost-effective remedy for weak reading instruction. The number of public school students enrolled in special education programs jumped by 243,000 students since 2019–20, even as total enrollment fell (see Figure 3). District leaders tell us that many of these students were referred for learning disabilities when pandemic-era closures left them behind in reading.
Special Education Enrollment Up (Figure 3)
On average, schools are referring more students to special education.
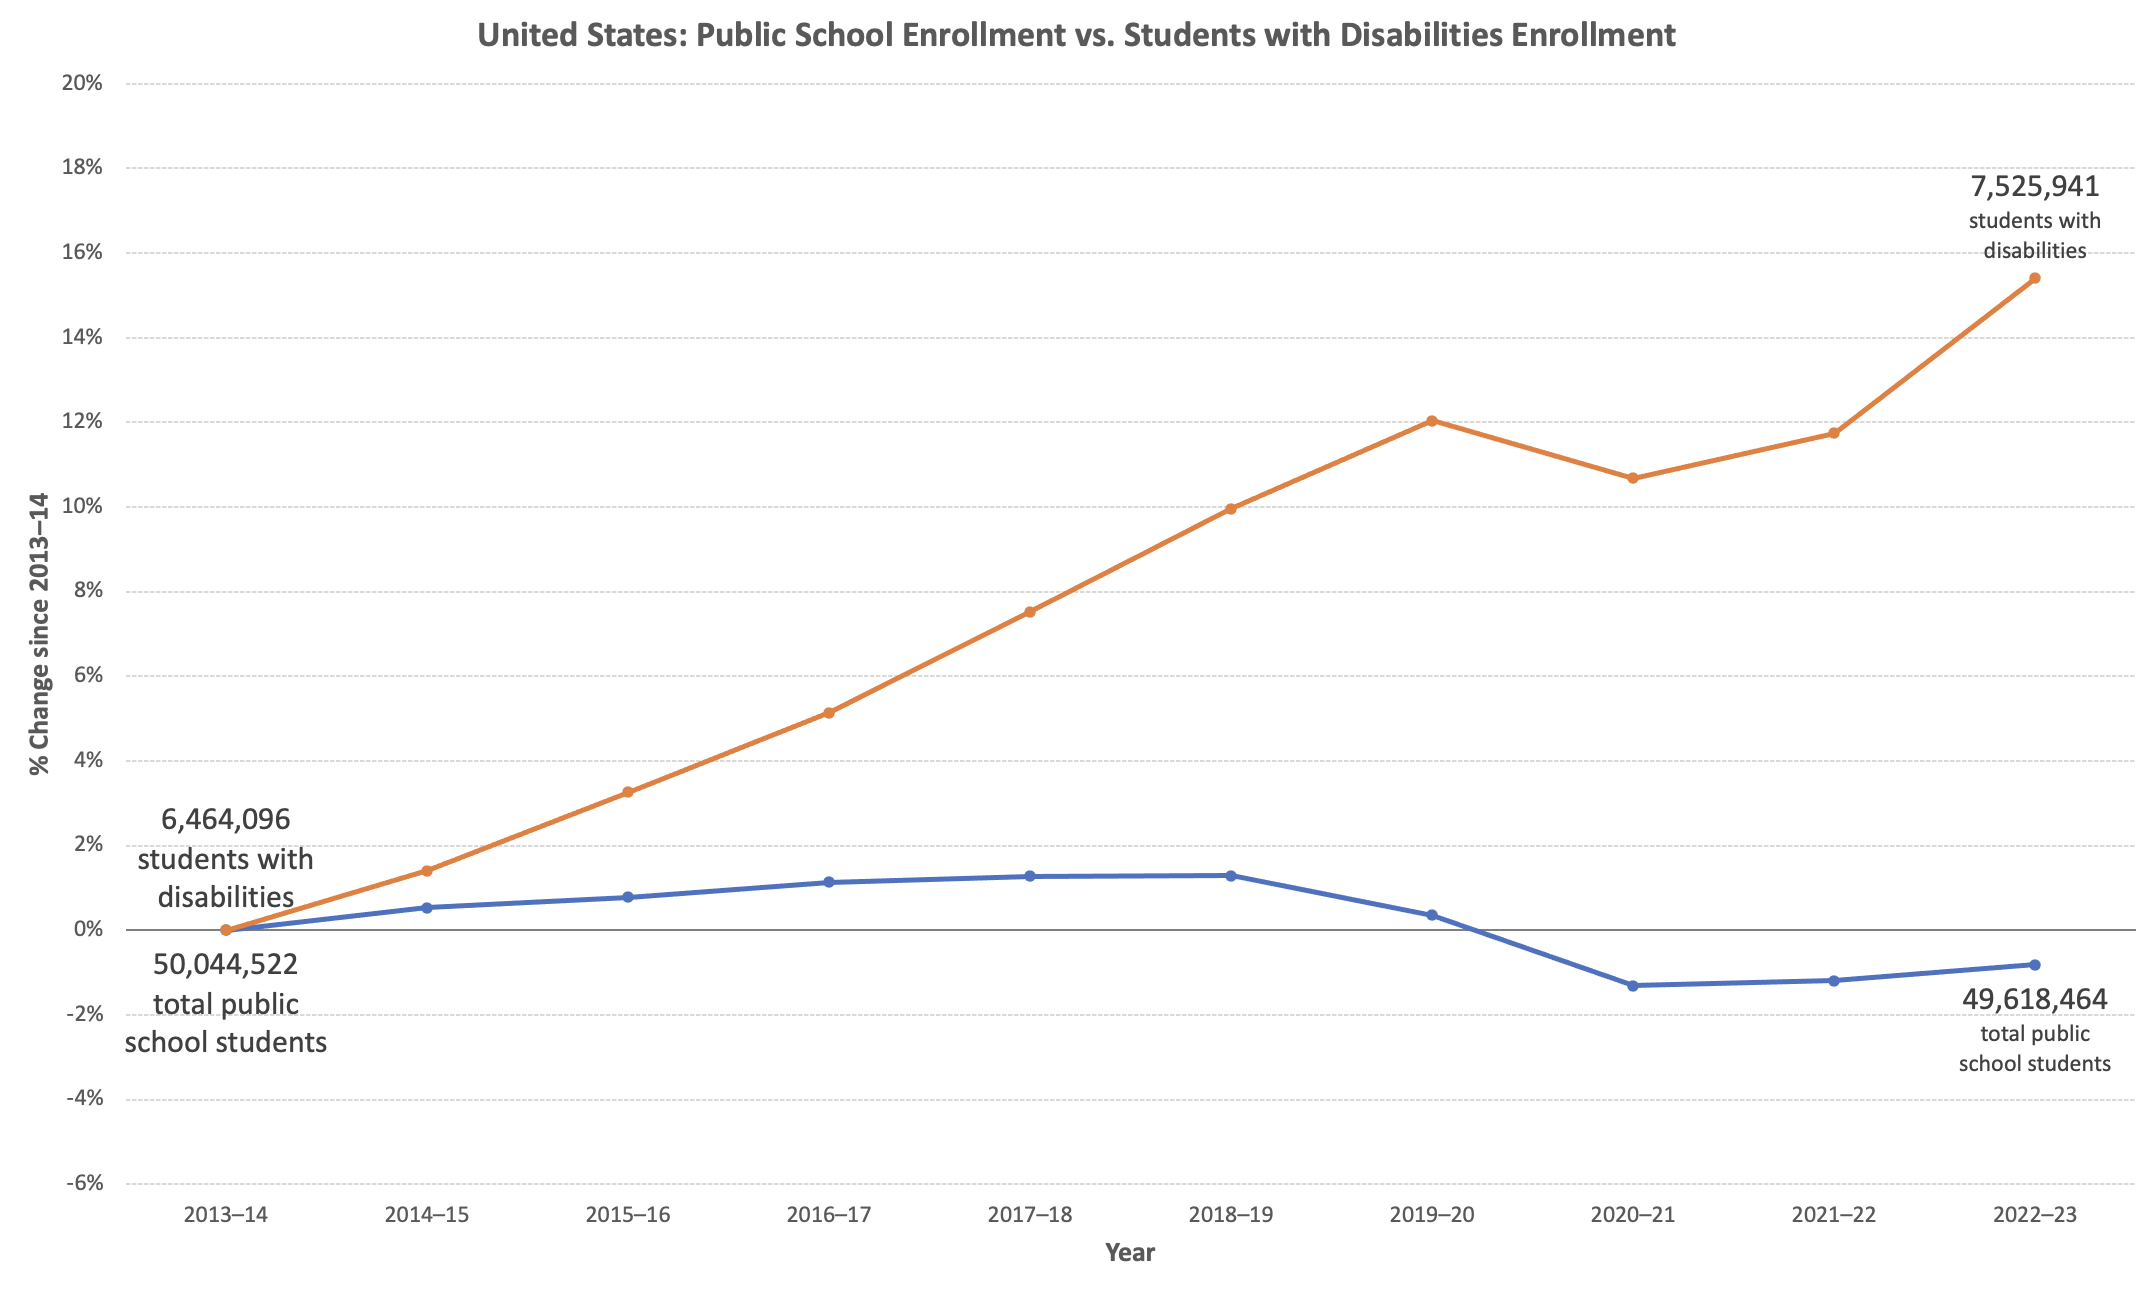
Source: NCES
More referrals have raised costs for special education. Districts also used ESSER to boost staffing for special education services to better serve students.
Are these added investments helping students? Our analysis of NAEP data finds that states with higher identification rates of learning disabilities do not deliver better reading outcomes for these students. Nor are states with comparatively more staff-intensive special education programming producing higher reading scores.
What does work? Where states deliver better reading instruction for general education students, students enrolled in special education benefit, too—a pattern that has also been documented in research on high-performing public charter schools (see “A Charter Boost for Special-Ed Students and English Learners,” research, Spring 2020). Leaders seeing outsized growth in special education identification rates might consider focusing their limited dollars instead on improving Tier 1 reading instruction.
EdNext in your inbox
Sign up for the EdNext Weekly newsletter, and stay up to date with the Daily Digest, delivered straight to your inbox.
5. In many districts, budgeting isn’t oriented toward value for students. Our team observed 260 ESSER-era school budget workshops and found that only a quarter made any mention of student outcomes of any kind in their deliberations. In only 16 percent of meetings did leaders weigh different options to maximize student outcomes, and in only 13 percent did they revisit past investments to gauge whether they worked before renewing them.
The budget process is so routinized, so stuck in an annual cycle of perpetuating the prior year budget, that it leaves almost no room to respond to changing conditions—even when those conditions are profound learning gaps and a windfall in federal funds. In the first full year pandemic-relief funds were available from the American Rescue Plan, districts spent only 14 percent of the grant funds, largely because those monies were held up in district budget cycles that left no room for a more nimble, urgent response. The typical timeline has districts approving each year’s budgets months before the test scores come out—scores that would shed light on whether prior investments are working.
Districts can tweak their own budgeting processes, but some small nudges from states could help reorient budgeting on a larger scale. Specifically, states could require that student outcomes be reviewed as part of the budget process and that the budget be reviewed when new test scores emerge. And states could establish minimum financial training requirements for district leaders and board members so they are better equipped to factor in returns on investments during each budget cycle.
*
If learning growth continues after ESSER ends, it will be because leaders have found a way to get more value from each remaining dollar. The good news: ESSER has given the system some clues on how to do just that.
Marguerite Roza is Director of Edunomics Lab and Research Professor at Georgetown University, where she leads the Certificate in Education Finance. Maggie Cicco is a Research Fellow at the Edunomics Lab.
For more, please see “The Top 20 Education Next Articles of 2024.”