When the National Assessment of Education Progress results are released on Tuesday, reporters, educators, and policy wonks will have a lot to digest. Over the past several weeks, I’ve examined recent trends at the national, state, and local levels. First let me review the highlights, then identify seven stories to watch when the new data go live.
• After big increases in the late 1990s and early 2000s, especially in math, especially in fourth grade, and especially for our lowest-performing students and disadvantaged subgroups, national trends have been mostly flat for almost a decade.
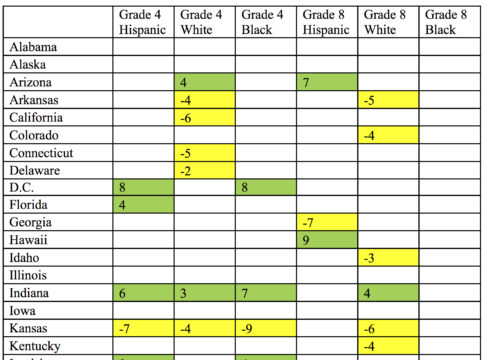
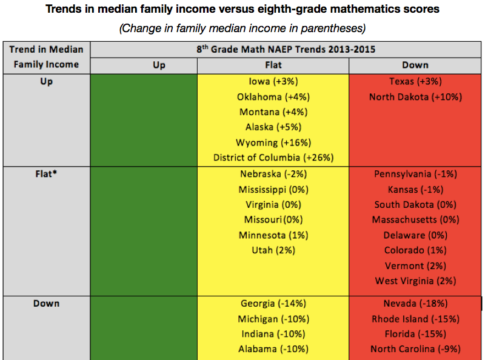
• However, the national picture hides a lot of state-by-state variation. In the past, states including North Carolina, Texas, Florida, and Massachusetts have made big improvements. More recently, the District of Columbia, Indiana, and Tennessee have posted big gains, overall and for most subgroups. On the flip side, quite a few states have lately regressed in math; Texas and Kansas saw some of the most widespread declines.
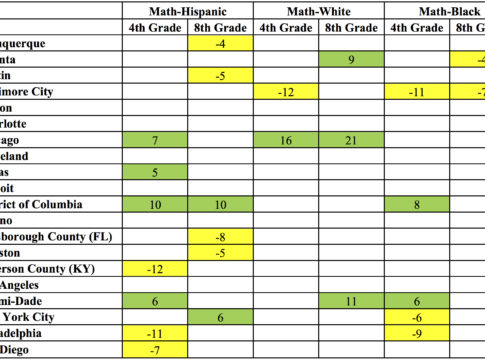
• Among large urban districts, the progress of D.C. Public Schools, Chicago, and Miami is especially impressive since 2011.
 With that in mind, what should we be looking for next Tuesday?
1. Will the flat national trends continue? Given recent history, this is the safest bet. But predictable doesn’t make it any less disappointing. It will be time to start talking about the “lost decade” for educational progress in the United States. The question is why we hit a wall in the late 2000s. Was it the recession? Kirabo Jackson thinks it could have been. Was it the accountability movement running out of steam? Something else? We can speculate, but it will take rigorous scholarship to ferret this out.
2. Did the switch to tablet-based assessments have an impact on the scores? The 2017 score release was delayed by months because the experts at the National Center for Education Statistics wanted to make sure that the switch from paper-and-pencil testing to tablet-based assessments—fully implemented this round for the first time—didn’t mess up the findings. But were they able to adjust the scores appropriately, including at the state and local levels? Louisiana state superintendent John White is not so sure. If scores drop among low-income and low-performing students—the kids least likely to be comfortable with digital devices, especially in the fourth grade—that could signal that something went awry, possibly that the scores aren’t truly comparable with those that came before. And that would have a particularly large impact on states and districts serving lots of disadvantaged students—especially because NCES included a paper-and-pencil sample at the national level large enough to ensure consistent national trends but did not do the same at the state and local levels.
Another question to ask: Did the states that still use paper-and-pencil tests for their own annual assessments do worse? Most states now employ online tests for grades three through eight, with exceptions allowed for students with disabilities. But there some paper-and-pencil holdouts, and their students may be at a disadvantage on the new NAEP. Seven states give districts the option of using paper-and-pencil tests: Iowa, Louisiana (for grades three and four), New York, North Carolina, Pennsylvania, South Carolina, and Texas. Another two use paper-only assessments through grade four: Oklahoma and Tennessee. And Kentucky uses only paper tests for all grade levels. If these states in particular see declines, it could be because of the tablet-based testing format.
3. What’s the verdict on the Michelle Rhee/Kaya Henderson era in Washington, D.C.? After years of positive press and lavish praise from reformers, the District of Columbia Public Schools have faced a series of scandals in recent years. A debate is now raging about whether the remarkable progress reported there was real. The new scores will give us more clues about which view is right. Keep in mind that we should look at trends over at least four years, and especially for subgroups, given D.C.’s rapidly changing student demographics. But if this is the year that D.C.’s meteoric rise in NAEP scores ends—a rise that started before Rhee—it will surely strengthen the argument of those who think that the DCPS reforms were overhyped.
4. Is Indiana still an Ed-Reform Idol? The state’s progress from 2011 to 2015 was remarkable, with gains in both reading and math, in both fourth and eighth grades, and across all major racial groups. We can’t know for sure what accounted for this progress but it’s surely possible that the reforms of the Mitch Daniels/Tony Bennett era paid off. Did they continue on (then-governor) Mike Pence’s watch? And will any other states steal the spotlight—perhaps including Arizona?
5. Fiesta, forever, in Miami? Alberto Carvalho, the superintendent of Miami-Dade County, made a big splash this year when he accepted, and then rejected, an offer from Bill de Blasio to serve as New York City’s schools chancellor. His impressive progress on NAEP was a big part of his calling card; will it continue through 2017? He’s scheduled to speak at the release of the data next week, which could signal that the party will continue.
6. Is Chicago’s fifteen minutes of fame over? Chicago Public Schools have received numerous accolades of late, thanks to an analysis by Sean Reardon that examined “cohort gains” on state assessments and NAEP that showed tremendous movement as students progressed through elementary and middle school. But as I pointed out the other day, the district’s fourth graders have also made big gains of late, which ironically will make it harder for the district’s cohort gains to look as impressive going forward, at least on NAEP. I hope Chicago enjoyed its moment in the sun while it lasted.
7. Is the “California Way” working? Over the past decade, California has been a holdout from some of the big national reforms that most other states have embraced, especially clear and tough school accountability systems and test-based teacher evaluations. State board chair Mike Kirst has argued that the Golden State’s approach leads to more teacher buy-in and will prove itself in the end. And at least in a few subgroups, California has seen some progress in recent years. What will the 2017 data show?
For me, of course, there is one last question to ask: What will I do when I no longer have NAEP to obsess about? The 2019 results should be out soon enough—unless, of course, they go back to paper-and-pencil!
— Mike Petrilli
Mike Petrilli is president of the Thomas B. Fordham Institute, research fellow at Stanford University’s Hoover Institution, and executive editor of Education Next.
This is the fifth and final post in a series of commentaries leading up to the release of new NAEP results on April 10. The first post discussed the value of the NAEP; the second looked at recent national trends; the third examined state-by-state trends; and the fourth reviewed urban trends.
This post originally appeared in Flypaper.