Is there a shortage of special education teachers in America’s public schools? If so, why? And how can policymakers fix it?
The first question sounds like an easy one. Yes, there is a shortage of special education teachers. In 2023–24, more than half of districts and 80 percent of states reported such a shortage.
If you doubt the self-reported data, a simple back-of-the-envelope calculation will lead you to the same conclusion. About 46,000 special education teachers leave public schools every year, while teacher preparation programs are training fewer than 30,000 new ones to replace them. Even if districts can supplement those new trainees with teachers who are re-entering the profession, that still makes for a very tight labor market.
These numbers might lead policymakers to conclude that special education shortages are largely a supply problem, but that is not so. Over time, the number of people working in special education roles has risen rapidly, but the demand for them has risen even faster. In fact, I estimate that demand-side growth can account for about two-thirds of the gap between school districts’ annual hiring needs and the number of new special education teachers being produced. Supply-side solutions are not likely to close this gap on their own.
Before diving deeper into the data and discussing possible solutions, it’s worth noting that this disconnect is not a new phenomenon. In fact, when Bellwether Education Partners looked at which school subjects states reported as staff shortage areas from 1998–2018, it found that most states reported an insufficient number of special education teachers in most of those years. Over this 21-year period, only four states identified special education as a shortage less than half the time. Nine states—Florida, Iowa, Kansas, Kentucky, Louisiana, Maine, Nebraska, Texas, and Wisconsin—reported a special education staffing shortage every year for 20 years straight. In other words, something long-term and persistent is at work.
This teacher shortage negatively affects students. Due in part to the supply-demand disconnect, students with disabilities are more likely to be assigned to novice teachers who are less effective at fostering learning and raising student achievement.
To solve these problems, policymakers will need to grapple with the complex realities of the special-education labor market. That starts by understanding the demand side of the equation.
Rapidly Rising Demand
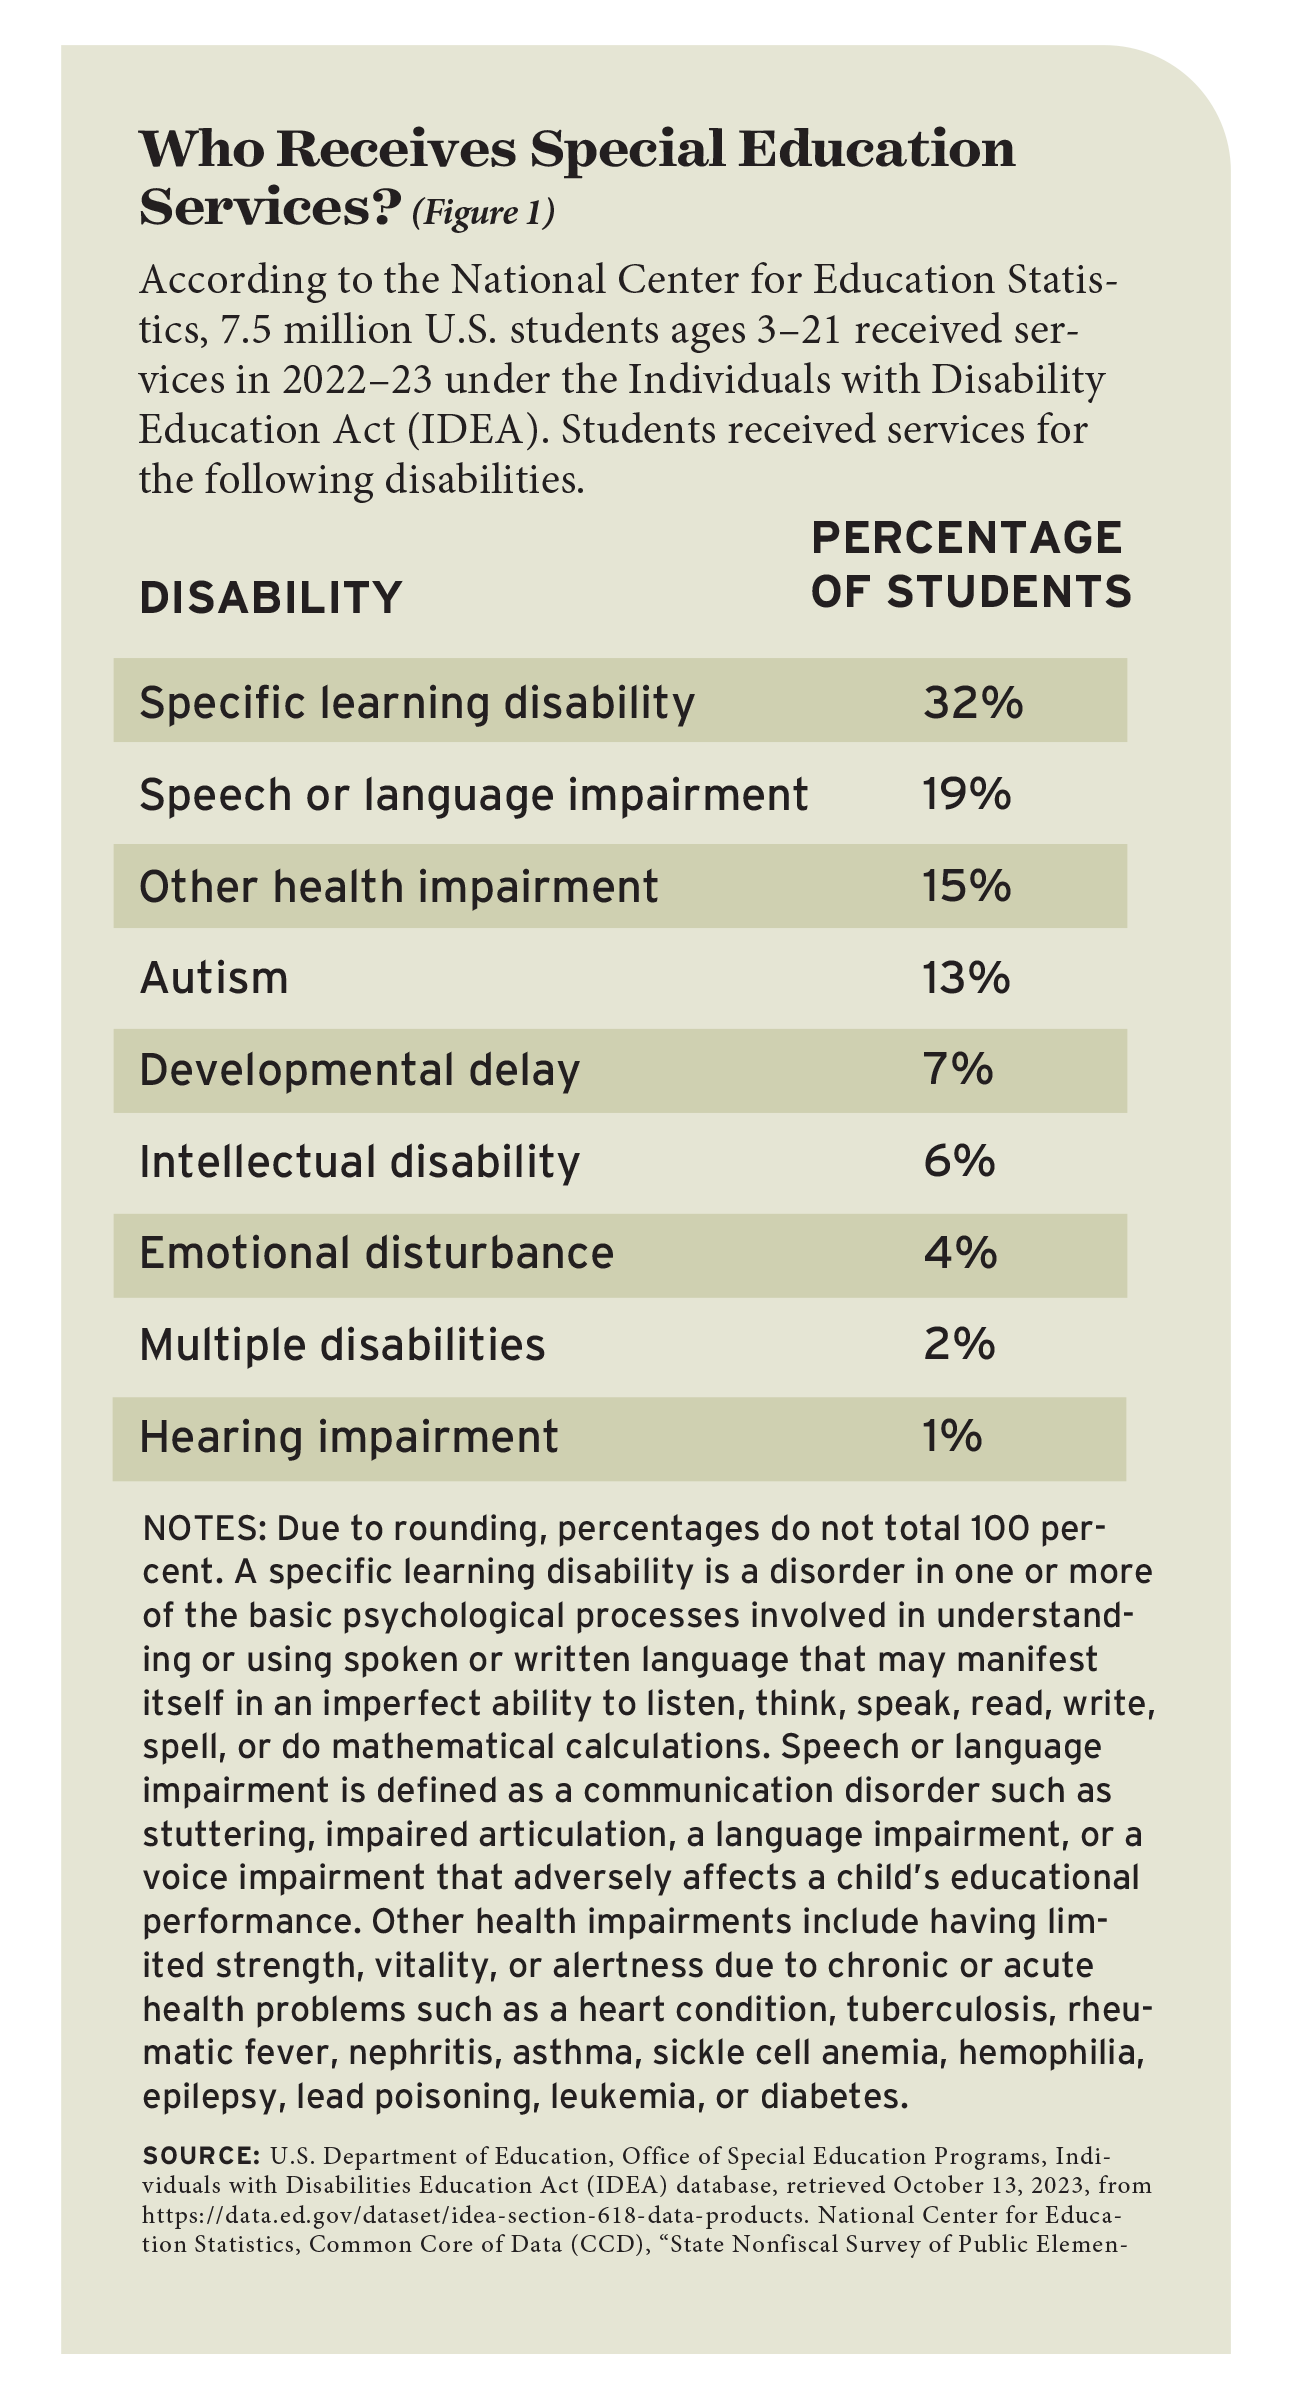
The percentage of public school students who receive special education services has risen over time, reaching 15 percent in 2022–23. That increase has been propelled by a number of factors, including better and earlier identification of students who need additional support. (See Figure 1 for a breakdown of disability types among students receiving services.) It’s also been driven by federal policies such as reauthorizations of the Individuals with Disabilities Education Act (IDEA), as well as better scientific and cultural understanding of how best to serve students with learning differences.
National data don’t tell us much about the specific services that students with disabilities receive, other than the fact that students are now more likely to be included in general classes in regular schools. Disability advocates have long pushed for more “inclusive” education settings by arguing that they are better for students and that many general education teachers can accommodate students with special needs, perhaps with the assistance of a paraprofessional or instructional aide. Whether this shift to mainstreaming is in fact better for all students with disabilities, it has continued: over the last decade, the percentage of students receiving IDEA services who spend 80 percent or more of their school day in general classes has risen from 61 percent to 67 percent (see “Has Inclusion Gone Too Far?,” features, Fall 2018). Theoretically, this shift should have allowed schools to employ fewer dedicated special education teachers and slightly more aides.
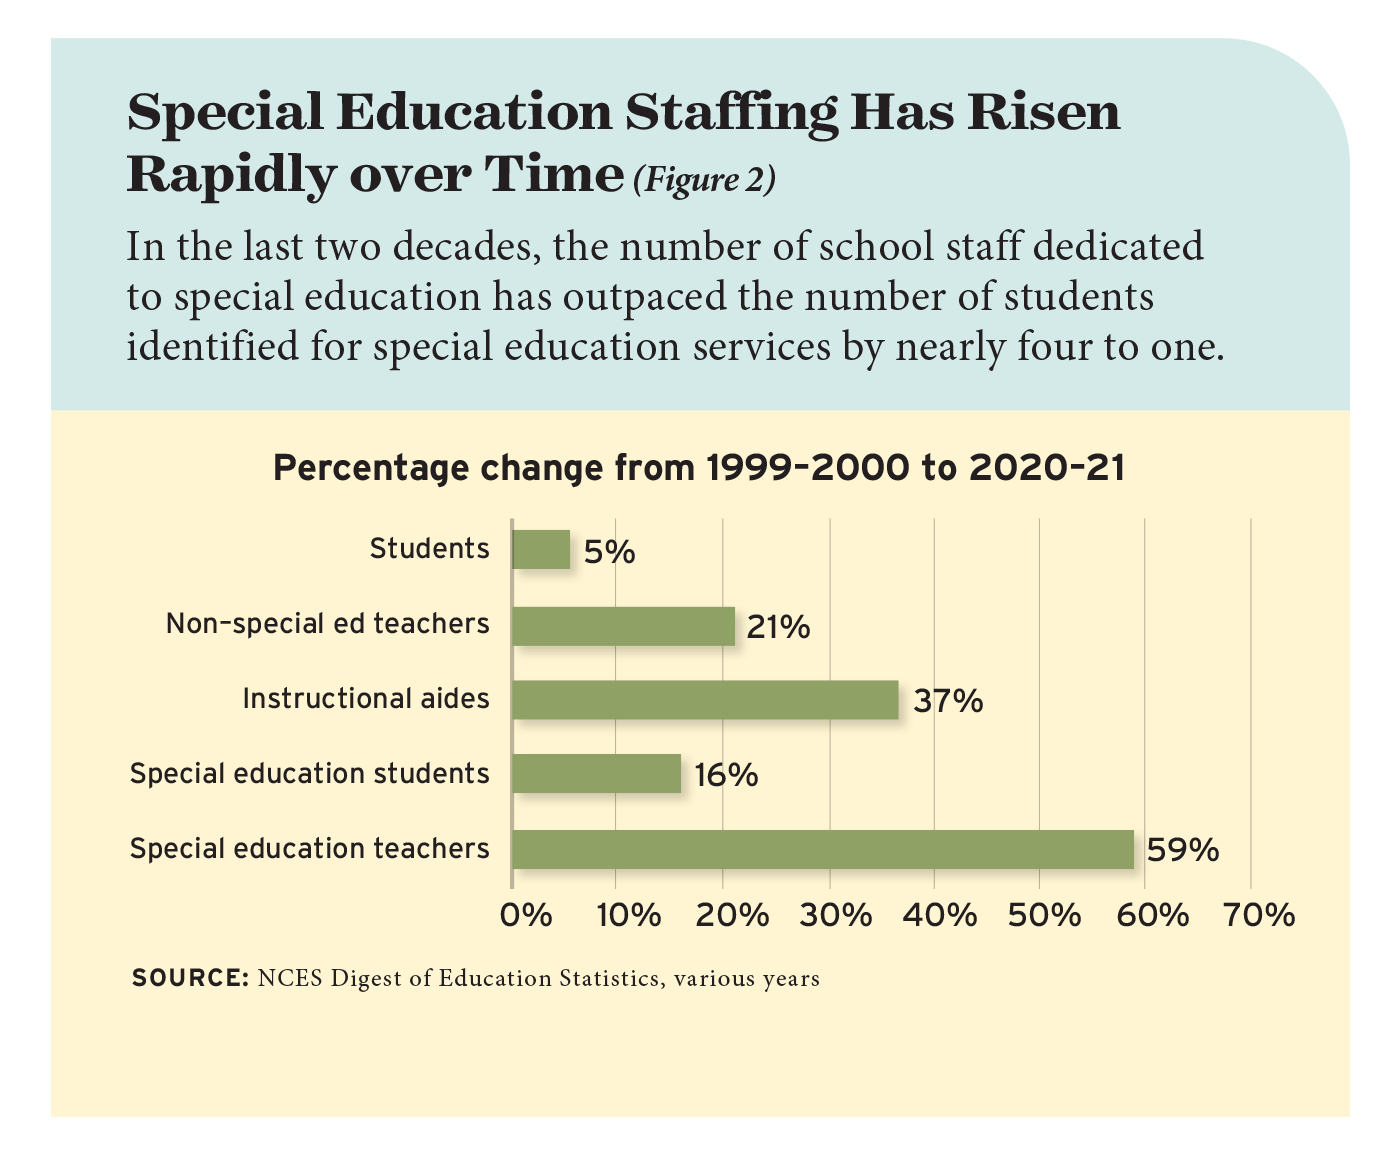
But that has not happened. Instead, the number of special education teachers and instructional aides has grown much faster than the number of students identified for special education services. Figure 2 shows the percentage change over time among select student and staffing categories. From 1999–2000 to 2020–21, student enrollments rose 5 percent overall, the number of non-special-education teachers rose 21 percent, and the number of instructional aides (whose role is often to support special education students) rose 37 percent.
Meanwhile, the number of students receiving special education services rose 16 percent and the number of teachers serving in special education roles rose 59 percent.
In other words, schools employ more special education teachers than ever before. That is true whether these educators are counted in absolute numbers, relative to the overall student population, or relative to the number of students identified for special education services. Any “shortage” of special education teachers is at least partly due to ever-growing demand.
How much is growing demand contributing to the shortage? A lot. If public-school special-education teaching positions had merely grown at the same rate as students identified for special education services in those schools, schools would employ 146,000 fewer teachers in those roles. Assuming turnover rates stayed the same, their annual hiring needs would shrink by nearly two-thirds.
It’s also worth noting that the percentage of students receiving special education services varies greatly by state, as do judgments about what constitutes sufficient staffing. For example, Maine, New York, and Pennsylvania identify more than 20 percent of their students for special education services, while schools in Hawaii, Idaho, and Texas identify less than 12 percent of their students. In terms of staffing, for every 100 children served under IDEA, Oklahoma schools employ the equivalent of 18 full-time special education teachers. At the other extreme, Indiana employs just one full-time special education teacher per 100 students served. These differences reflect a collection of state and local choices, and they will inevitably affect a state’s labor market for special educators.
Readers may wonder how the schooling disruptions associated with the Covid-19 pandemic affected the special-education labor market. National data specific to public schools is not yet available, but the Bureau of Labor Statistics’ state-level Occupational Employment and Wage Statistics data show that special-education teaching-staff levels held up relatively well. Including public and private schools, the BLS data show the number of special education teachers dipped slightly in 2020 and 2021 but rebounded in 2022 and was 9 percent higher than 2019 levels by 2023. (One key exception here is teaching-assistant positions, which fell much farther and were still down 10 percent in 2023.)
Broadly speaking, the trends in special education have been an exaggerated version of those for the larger education labor market. Schools emerged from the pandemic with more teachers and other staff, in both raw and per-pupil terms.
That’s not to say there aren’t fewer teachers in some schools or communities, and school and district leaders might prefer to have more applicants to choose from or may feel that the candidates who apply are not as qualified as they would like. For special education candidates specifically, it’s possible there’s a mismatch between the training those teachers received versus the skills schools are looking for. But the pandemic does not appear to have dramatically altered the long-term staffing picture.
Supply Shortfall
The work of special education teachers is hard. These teachers report higher workloads than others, especially early in their careers. As a result, some state-level analyses have found that, compared to general education teachers, special education teachers are more likely both to move to other schools and to leave teaching. At the national level, a 2021–22 National Center for Education Statistics (NCES) survey found that, compared to general-education public-school teachers, special education teachers were about 0.5 percentage points more likely to leave the profession entirely and 1 percentage point more likely to change schools. The survey found similar turnover differences between general and special education teachers in private schools, suggesting there may be inherent challenges in special education roles in both the public and private sectors.
When someone leaves a special education position, that creates an opening. Since there are a lot of special education teachers, there are also a lot of special education openings every year.
Data from the NCES illustrate the scale of the disconnect nationally. In 2020–21, public schools employed 541,000 special education teachers across elementary and secondary schools. Among those teachers, 8.5 percent left teaching and another 9.2 percent changed schools the following year. That means public schools needed to replace roughly 96,000 special education teachers that year.
Omitting from the count those who remained special education teachers but moved from one school to another, that still left a gap of about 46,000 special education jobs that needed filling. Those spots wouldn’t all have to be filled by teachers fresh out of a preparation program. One of the biggest sources of new hires is re-entrants—people who leave teaching for personal or other reasons and then decide to return. Nationally, depending on the year, 20 to 30 percent of new hires in public schools are re-entrants. If those percentages apply to special education hiring as well, that still leaves a large demand for newly licensed special education teachers. And over the last decade, teacher preparation programs have produced only 25,000 to 30,000 new special education teachers per year. This crude comparison points to a very tight labor market for these educators.
The preceding numbers probably undercount the national problem because they don’t account for any growth in special education positions, they ignore the private school sector’s demand for new special educators, and they include general education teachers who decide to retrain and earn a special education license. Worse, this comparison assumes that all newly licensed special education teachers accept a position as a special education teacher. In fact, many people who train to become special education teachers do not end up serving in such roles (more on this later).
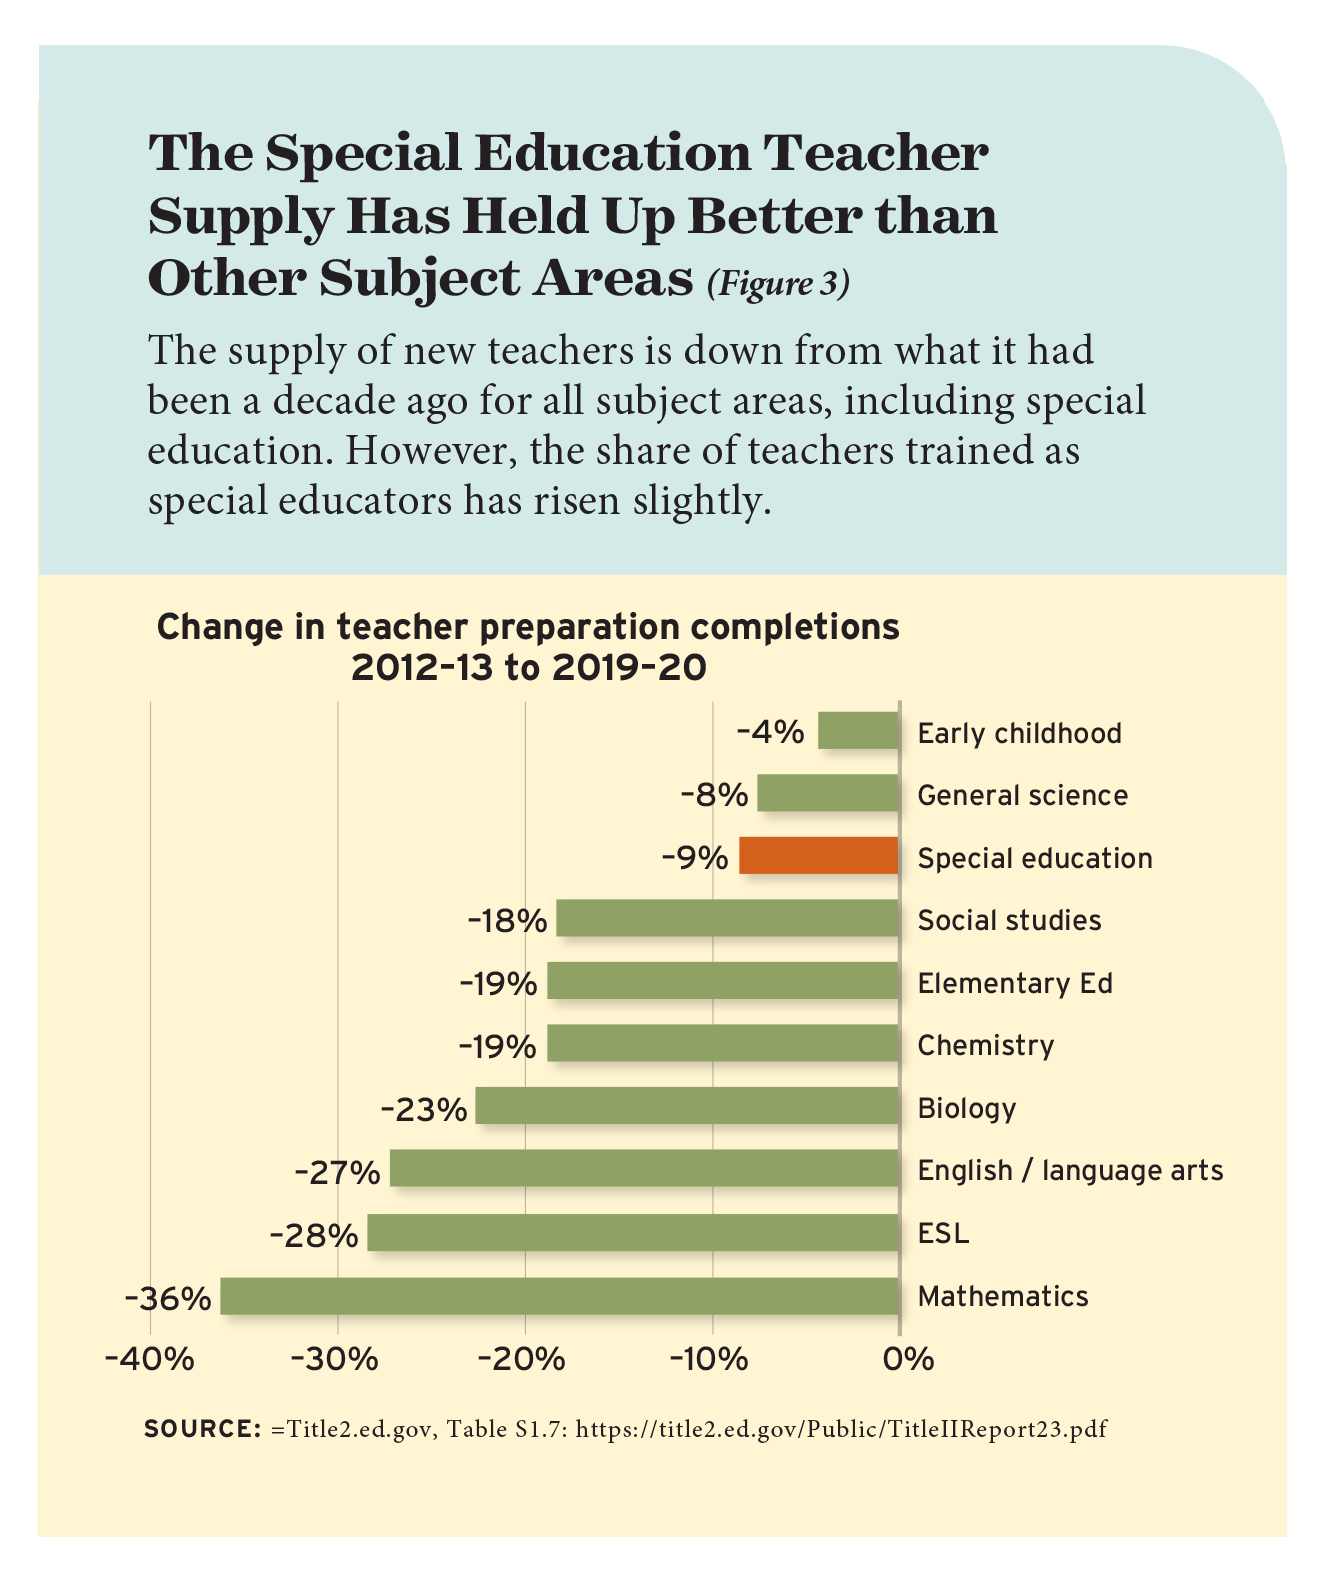
The overall supply of teacher-preparation completers is down from where it was a decade ago. However, the supply of new special education teachers did not fall as far, and it has rebounded more strongly than the supply of new teachers in subject areas such as mathematics and English as a second language. (See Figure 3.) In fact, because of those differences, the share of new teachers with a special education endorsement has actually risen somewhat over the last decade.
The supply numbers shown in Figure 3 include all types of teacher preparation programs, which raises questions about the quality of the supply. Over time, a higher and higher share of new teachers are being trained in faster and cheaper alternative-route preparation programs. That’s true for all teachers: the share of newly prepared teachers coming from traditional programs fell from 86 percent in 2013 to 75 percent in 2020. But the numbers fell even faster in special ed, in which they dropped from 83 percent to 69 percent over the same time span.
It seems logical that better-trained teacher candidates would become better teachers. However, the empirical evidence supporting that theory is mixed. For example, a 2013 study by Li Feng and Tim R. Sass found that teachers of special education courses were more effective at teaching reading if they had pre-service training in special education. In contrast, Allison F. Gilmour’s 2020 study found that those gains may have been driven by teachers who had dual certification in both general and special education and concluded that “existing studies of certification and the academic outcomes of [students with disabilities] suggest that the association between these variables is sensitive to student samples, modeling choices, and how certification is defined.”
It’s also not clear what role a pre-service preparation program can or does play in shaping teacher effectiveness without considering the school setting where the teacher begins working. For example, Roddy Theobald and colleagues looked at the interaction between reading programs used by special-education preparation programs and the districts that the candidates eventually worked in. Looking across all new teachers, the researchers did not find any statistically significant differences in effectiveness based on the preparation programs teachers attended. However, they did find that teachers who were trained to use research-based practices in the “science of reading” were particularly effective when they taught in districts that also emphasized that approach. One potential takeaway from this line of research is that policymakers should not view teacher preparation requirements as a sufficient policy lever—on their own—to ensure teachers will be successful at working with students with disabilities.
EdNext in your inbox
Sign up for the EdNext Weekly newsletter, and stay up to date with the Daily Digest, delivered straight to your inbox.
The Reality on the Ground
Regardless of which moment in time one considers, the special education labor market has been one of the worst, if not the worst, shortage area across the country. The problem intensifies when the supply numbers go down, as they did over the last decade, and when demand goes up, as it did thanks to the one-time federal relief funds after Covid-19. But to focus only on the current moment would misdiagnose this as a temporary problem when it’s much more persistent than that.
So how do schools fill their open special education positions? In some cases they don’t––at least not before the school year starts. Dan Goldhaber and a team of researchers at the University of Washington Center for Education Data & Research and the American Institutes of Research have found that there are proportionally more job openings in special education, that they take longer to get filled, and that the gap between special education and general elementary positions only grows as the school year goes on. That work has also documented that the challenge of recruiting and retaining special education teachers is especially difficult in rural communities and in schools with high concentrations of low-income students.
But per the aforementioned national data, a lot of positions are filled. And without adequate supply to meet their demands, schools often turn to unlicensed or emergency-credentialed teachers. The federal IDEA law requires states to establish minimum qualifications for teachers of children with disabilities, including at least a bachelor’s degree, and does not permit special education teachers to work under temporary, emergency, or provisional permits. Paraprofessionals and teacher assistants as well as other support staff must also be fully licensed in their respective areas.
And yet the federal Office of Special Education and Rehabilitative Services found that only 92 percent of special education teachers and 93 percent of special education paraprofessionals were fully certified as of the fall of 2020. That means schools were employing 35,000 people in special education teaching roles plus 37,000 people in support roles who were not fully certified for those positions.
These numbers point to a troubling pattern. Schools have many special education job openings. Without a sufficient talent pool, they end up hiring a cadre of young, emergency-licensed teachers—federal law notwithstanding. Those teachers are in turn more likely to leave, which leads to more job openings. This self-reinforcing cycle will repeat itself unless policymakers take steps to break it.
Addressing the Supply-Demand Mismatch
The supply-demand mismatch in special education can’t be solved by focusing on the supply side alone. That’s because, even in states with a robust supply of special education teachers, those candidates do not all wind up working in special education roles. In Washington state, for example, Theobald and colleagues analyzed the data and concluded that “thousands of teachers in the state each year were deemed eligible by the state . . . to be special education teachers but were not serving in special education teaching positions.” Similarly, in a year when Minnesota schools reported a shortage of 500 special education teachers, Beth Hawkins analyzed the state’s licensing records and found 1,500 licensed special education teachers who were working in regular roles that did not require those certifications.
In other words, closing the gap will require district officials to acknowledge the added challenges of being a special educator. Currently, only about one in seven districts offer financial incentives to recruit or retain teachers in any hard-to-staff jobs, which means that, in many districts, special education teachers earn nearly identical compensation as other teachers. Even among large urban districts, which are more likely than other districts to offer stipends and other salary differentials, the National Council on Teacher Quality found that less than half (43 percent) offered a financial incentive for special educators. That count may even be generous because it included some stipends and other salary supplements that may be too small to actually shape worker behavior, one-time bonuses, and payments that were limited only to certain subsets of special education teachers such as those with expertise in bilingual instruction.
One state that has tried a more-aggressive financial-stipend policy is Hawaii. Faced with vacancy rates that were much higher in special education than for all other positions, the state offered a $10,000 stipend for those willing to work in special education roles, plus another $8,000 for any teacher who worked in a hard-to-staff school. A beginning special education teacher in Hawaii who decided to work in a hard-to-staff school would have seen their pay rise to $67,100 from $49,100. Even that sizable incentive did not eliminate all vacancies, but it helped districts fill previously hard-to-staff roles and substantially reduced the special education disadvantage, especially in higher-poverty schools.
Local leaders may want to consider other radical solutions to special education shortages. For instance, if special educators feel isolated and unsupported, leaders might look at team-based staffing models such as those championed by Opportunity Culture, the Teacher Advancement Project, or Arizona State University’s Next Education Workforce initiative.
Acknowledging the full spectrum of issues at play in the special education labor market offers a nuanced story, not a simplistic tale of teachers shunning careers as special educators. It also provides a more optimistic lens through which policymakers can see the full picture and develop a blueprint for actually addressing the problem.
Chad Aldeman writes about school finance and the teacher labor market and is the founder of Read Not Guess, an initiative to help parents teach their kids to read.
This article appeared in the Fall 2024 issue of Education Next. Suggested citation format:
Aldeman, C. (2024). Where Are All the Special Educators? Schools employ more special education teachers than ever. So why is there a shortage? Education Next, 24(4), 38-43.
For more, please see “The Top 20 Education Next Articles of 2024.”