The next batch of results from the National Assessment of Educational Progress (NAEP) is due on October 28. Pundits of all persuasions are gearing up to jump on the news and promote their spin. But that’s for amateurs, I say. Why wait for regular old mis-NAEP-ery when you can practice pre-NAEP-ery?
Rumors abound that the news is going to be bad, with scores down nationally and in a bunch of states. That will be used as fodder to attack Common Core, teacher evaluations, charter schools, or whatever else you happen not to like that’s prominent in today’s education policy conversation.
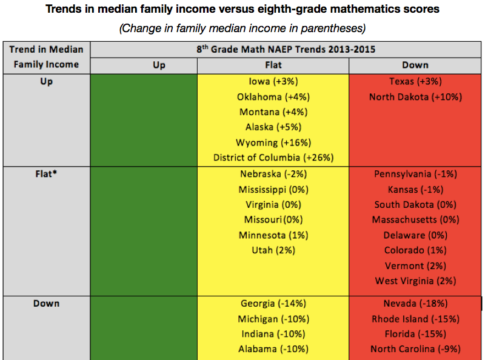
But let me suggest that journalists and editorialists consider the most likely explanation: It’s the economy, stupid. While those of us in education reform are working hard to make sure that demography does not equal destiny, we must also acknowledge the strong link between students’ socioeconomic status and their academic achievement (a link that some amazing schools are weakening).
In fact, the last time we saw national declines in NAEP scores was in the aftermath of the 1990 recession. That was particularly the case for reading. It makes sense—when families are hurting financially, it’s harder for students to focus on learning.
And let’s be clear: The American family has gotten hammered in recent years. Adjusted for inflation, the national median income for families with children dropped 6 percent from 2006 to 2014. In many states, it was much worse:
Change in Median Income of Families with Children: 2006–2014
| Nevada | -18% |
| Rhode Island | -15% |
| Florida | -15% |
| Georgia | -14% |
| Michigan | -10% |
| Indiana | -10% |
| Alabama | -10% |
| North Carolina | -9% |
| Arizona | -8% |
| California | -8% |
| Hawaii | -7% |
| Oregon | -7% |
| Ohio | -7% |
| Illinois | -7% |
| Wisconsin | -7% |
| Kentucky | -7% |
| South Carolina | -6% |
| Tennessee | -6% |
| U.S. | -6% |
| Arkansas | -5% |
| New York | -5% |
| Maine | -5% |
| New Mexico | -4% |
| New Jersey | -4% |
| Louisiana | -4% |
| Connecticut | -3% |
| New Hampshire | -3% |
| Idaho | -3% |
| Maryland | -3% |
| Washington | -3% |
| Nebraska | -2% |
| Pennsylvania | -1% |
| Kansas | -1% |
| South Dakota | 0% |
| Massachusetts | 0% |
| Delaware | 0% |
| Mississippi | 0% |
| Virginia | 0% |
| Missouri | 0% |
| Minnesota | 1% |
| Colorado | 1% |
| Utah | 2% |
| Vermont | 2% |
| West Virginia | 2% |
| Texas | 3% |
| Iowa | 3% |
| Oklahoma | 4% |
| Montana | 4% |
| Alaska | 5% |
| North Dakota | 10% |
| Wyoming | 16% |
| District of Columbia | 26% |
Note: Data are from Kids Count; I then used the Bureau of Labor Statistics’s inflation adjuster calculator to determine inflation-adjusted income.
So if I were a betting man, I’d wager that the states with big declines in median income are going to be the ones showing lower NAEP scores this time around. And the handful of places that have weathered the recession—or even thrived—are going to come out looking pretty good. (Washington, D.C.: Here’s looking at you, kid.)
We’ll know in a few days if I’m right.
– Mike Petrilli
This first appeared on Flypaper.